FusionCharts allows you to easily set a background image/movie for your chart. You can use this option to embed background images (GIF, JPEG or PNG), other SWF Files, or data tables (in image format) as your chart background.
To embed an image, all you need to do is set bgSWF property of <chart> element. You can also dynamically change the transparency of the loaded image using bgSWFAlpha property, which accepts any value between 0 and 100 (bgSWFAlpha property has a default value of 100).
Let us now see how we may use the bgSWF property in a chart, as shown below:
<chart caption='Sales Figures' labelDisplay='NONE' bgSWF='ChartBg.jpg' canvasBgAlpha='30' canvasBorderColor='333333' canvasBorderThickness='0' divLineColor='333333'>
    <set label='John' value='420' />
    <set label='Mary' value='295' />
    <set label='Tom' value='523' />
    <styles>
      <definition>
         <style name='myFont' type='font' isHTML='1' bold='1' size='11' color='FFFFFF' />
         <style name='myShadow' type='shadow' color='333333' angle='45' strength='3'/>
      </definition>
      <application>
         <apply toObject='YAxisValues' styles='myFont,myShadow' />
         <apply toObject='DataLabels' styles='myFont,myShadow' />
         <apply toObject='DataValues' styles='myFont,myShadow' />
         <apply toObject='Caption' styles='myFont,myShadow' />
      </application>
    </styles>
</chart>
{
"chart":{
"caption":"Sales Figures",
"labeldisplay":"NONE",
"bgswf":"ChartBg.jpg",
"canvasbgalpha":"30",
"canvasbordercolor":"333333",
"canvasborderthickness":"0",
"divlinecolor":"333333"
},
"data":[{
"label":"John",
"value":"420"
},
{
"label":"Mary",
"value":"295"
},
{
"label":"Tom",
"value":"523"
}
],
"styles":[{
"definition":[{
"style":[{
"name":"myFont",
"type":"font",
"ishtml":"1",
"bold":"1",
"size":"11",
"color":"FFFFFF"
},
{
"name":"myShadow",
"type":"shadow",
"color":"333333",
"angle":"45",
"strength":"3"
}
]
}
],
"application":[{
"apply":[{
"toobject":"YAxisValues",
"styles":"myFont,myShadow"
},
{
"toobject":"DataLabels",
"styles":"myFont,myShadow"
},
{
"toobject":"DataValues",
"styles":"myFont,myShadow"
},
{
"toobject":"Caption",
"styles":"myFont,myShadow"
}
]
}
]
}
]
}
In the above code, we're:
- Loading a background image ChartBg.jpg by setting it as bgSWF attribute. If your image file is in a different location, you'll need to specify the relative path. Note that due to security restrictions, your image file has to reside on the same sub-domain as chart SWF File and a relative path to the same has to be specified.
- Setting canvas alpha as 30, so that it becomes see-through for the background to appear.
- Defining styles for formatting of other chart elements.
When you view this chart (with the background image), you'll get something as under:
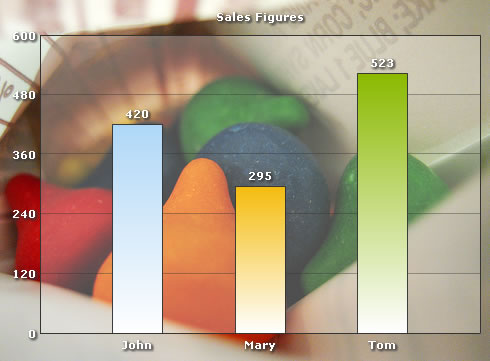
Simple and effective - isn't it?
For best results, you need to make sure that the background image and your chart have the same dimensions (width and height). Else, the loaded image would align at top left of the chart, as FusionCharts does not stretch the image to maintain proportions.