Zero plane is a plane which separates the positive and negative numbers on a chart having both of them.
The zero plane appears in the column, line and the area chart. It can be removed in the line chart but not in the column or the area chart because they use this as their base to draw. It can be removed in the line chart by setting showZeroPlane='0'.
The customizable attributes for the zero plane in a 2D chart are:
| Attribute Name | Range | Description |
| zeroPlaneColor | Hex color code without # | Color for the Zero Plane. |
| zeroPlaneThickness | In Pixels | Thickness of zero plane. |
| zeroPlaneAlpha | 0-100 | Alpha of zero plane. |
<chart zeroPlaneColor='000000' zeroPlaneThickness='1' zeroPlaneAlpha='80'....>
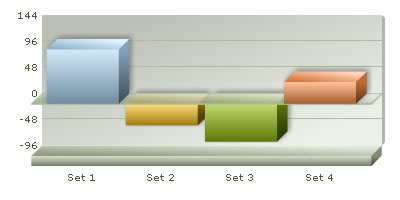
The attributes for the zero plane of a 3D chart are:
| Attribute Name | Range | Description |
| zeroPlaneColor | Hex color code without # | Color for the Zero Plane. |
| zeroPlaneAlpha | 0-100 | Alpha of zero plane. |
| zeroPlaneShowBorder | Boolean | Whether to show border of zero plane. |
| zeroPlaneBorderColor | Color | Sets the border color of zero plane. |
<chart zeroPlaneColor='FFFFFF' zeroPlaneAlpha='80' zeroPlaneBorderColor='999999'....>
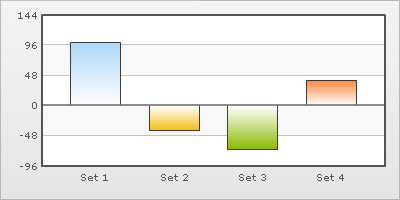
We can apply effects (shadow, glow, blur, bevel) to the div lines and zero plane using STYLES. To apply any style to the zero plane, we have to apply the style to the divisional lines. Here, we will see a chart having shadow for the div lines.
<chart showValues='0' >
   <set label='Set 1' value='100' />
   <set label='Set 2' value='-40' />
   <set label='Set 3' value='-70' />
   <set label='Set 4' value='40' />
   <styles>
      <definition>
          <style name='myShadow' type='shadow' angle='45' distance='3' color='000000'/>
      </definition>
      <application>
          <apply toObject='DIVLINES' styles='myShadow' />
      </application>
   </styles>
</chart>
{
"chart":{
"showvalues":"0"
},
"data":[{
"name":"Set 1",
"value":"100"
},
{
"name":"Set 2",
"value":"-40"
},
{
"name":"Set 3",
"value":"-70"
},
{
"name":"Set 4",
"value":"40"
}
],
"styles":[{
"definition":[{
"style":[{
"name":"myShadow",
"type":"shadow",
"angle":"45",
"distance":"3",
"color":"000000"
}
]
}
],
"application":[{
"apply":[{
"toobject":"DIVLINES",
"styles":"myShadow"
}
]
}
]
}
]
}
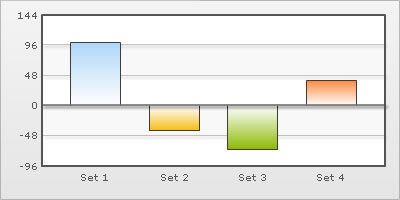
Similarly, the other effects can be applied to the div lines & zero plane.
You can also apply animation effects to the div lines & zero plane. In the data given below, the x-Scale of the div lines & zero plane will be animated.
<chart showValues='0' >
   <set label='Set 1' value='100' />
   <set label='Set 2' value='-40' />
   <set label='Set 3' value='-70' />
   <set label='Set 4' value='40' />
   <styles>
      <definition>
         <style name='myAnim1' type='animation' param='_xScale' start='0' duration='1'/>
      </definition>
      <application>
         <apply toObject='DIVLINES' styles='myAnim1' />
      </application>
   </styles>
</chart>
{
"chart":{
"showvalues":"0"
},
"data":[{
"name":"Set 1",
"value":"100"
},
{
"name":"Set 2",
"value":"-40"
},
{
"name":"Set 3",
"value":"-70"
},
{
"name":"Set 4",
"value":"40"
}
],
"styles":[{
"definition":[{
"style":[{
"name":"myAnim1",
"type":"animation",
"param":"_xScale",
"start":"0",
"duration":"1"
}
]
}
],
"application":[{
"apply":[{
"toobject":"DIVLINES",
"styles":"myAnim1"
}
]
}
]
}
]
}