A Pareto chart, named after Vilfredo Pareto, is a type of chart which contains both bars and a line. The values are represented by columns, which are arranged in descending order of magnitude, and the cumulative total of these values is shown by an upward curving line. Ideally, Pareto charts are used for isolating the key causes of a problem. However, they can also be used for determining the key factors of success.
The left vertical axis (primary axis) shows frequency of occurrence, but it can alternatively represent cost or another important unit of measure. The right vertical axis (secondary axis) shows the cumulative percentage of the total number of occurrences, total cost, or total of the particular unit of measure.
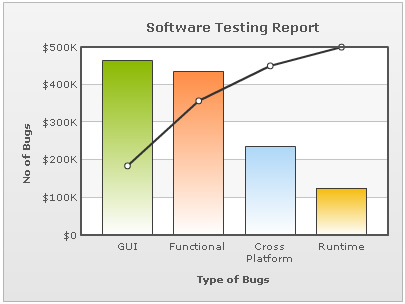
Show below is a simple Pareto 2D Chart:

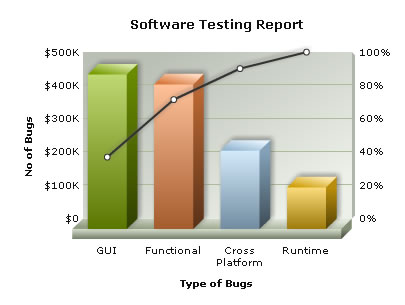
FusionCharts also has Pareto 3D charts.
The data for the above chart is shown below:
<chart showvalues="0" caption="Software Testing Report" numberprefix="$" xaxisname="Type of Bugs" pyaxisname="No of Bugs">
  <set value="235000" label="Cross Platform"/>
  <set value="125100" label="Runtime"/>
  <set value="464200" label="GUI"/>
  <set value="434500" label="Functional"/>
</chart>
{
  "chart":{
    "showvalues":"0",
    "caption":"Software Testing Report",
    "numberprefix":"$",
    "xaxisname":"Type of Bugs",
    "pyaxisname":"No of Bugs"
  },
  "data":[{
      "value":"235000",
      "label":"Cross Platform"
    },
    {
      "value":"125100",
      "label":"Runtime"
    },
    {
      "value":"464200",
      "label":"GUI"
    },
    {
      "value":"434500",
      "label":"Functional"
    }
  ]
}
Note that the data for this chart is single series. You only have to provide values for the column. The percent values for line is automatically calculated and added to the chart. If for some reason, you do not wish to add the line dataset, you can set:
<chart ... showCumulativeLine='0' ..>
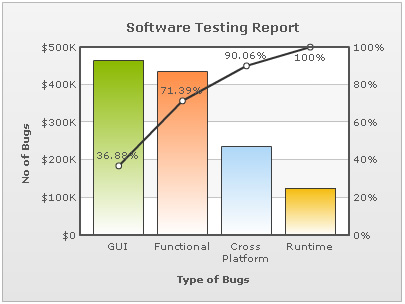
You can opt to show data values of the auto generated line series by using showLineValues attribute. Setting this attribute to 1 helps in displaying the line dataset values in your chart. Shown below is an example:
<chart showvalues="0" caption="Software Testing Report" numberprefix="$" xaxisname="Type of Bugs" pyaxisname="No of Bugs" showLineValues="1" >
  <set value="235000" label="Cross Platform"/>
  <set value="125100" label="Runtime"/>
  <set value="464200" label="GUI"/>
  <set value="434500" label="Functional"/>
</chart>
{
  "chart":{
    "showvalues":"0",
    "caption":"Software Testing Report",
    "numberprefix":"$",
    "xaxisname":"Type of Bugs",
    "pyaxisname":"No of Bugs",
    "showlinevalues":"1"
  },
  "data":[{
      "value":"235000",
      "label":"Cross Platform"
    },
    {
      "value":"125100",
      "label":"Runtime"
    },
    {
      "value":"464200",
      "label":"GUI"
    },
    {
      "value":"434500",
      "label":"Functional"
    }
  ]
}
The above XML/JSON yields the following result:
You can customize the properties of line series using the following <chart> attributes:
<chart showvalues="0" caption="Software Testing Report" numberprefix="$" xaxisname="Type of Bugs" pyaxisname="No of Bugs" lineThickness="3" lineColor="FF0000" lineAlpha="80" lineDashed="1" lineDashLen="5" lineDashGap="5">
    <set value="235000" label="Cross Platform"/>
    <set value="125100" label="Runtime"/>
    <set value="464200" label="GUI"/>
    <set value="434500" label="Functional"/>
</chart>
{
"chart":{
"showvalues":"0",
"caption":"Software Testing Report",
"numberprefix":"$",
"xaxisname":"Type of Bugs",
"pyaxisname":"No of Bugs",
"linethickness":"3",
"linecolor":"FF0000",
"linealpha":"80",
"linedashed":"1",
"linedashlen":"5",
"linedashgap":"5"
},
"data":[{
"value":"235000",
"label":"Cross Platform"
},
{
"value":"125100",
"label":"Runtime"
},
{
"value":"464200",
"label":"GUI"
},
{
"value":"434500",
"label":"Functional"
}
]
}
This results in:

If you wish to hide the y-axis values of secondary axis, you can set:
<chart ... showSecondaryLimits='0' showDivLineSecondaryValue="0" ...>
This results in: