FusionCharts offers 5 palettes for you to choose from. The palette theme configures colors of the following:
- Background and border
- Canvas border and background
- Fonts
- Div lines
- Tooltip
- Anchors
- Legend
The palettes are numbered 1 to 5 and can be chosen using:
<chart palette='1' ...>
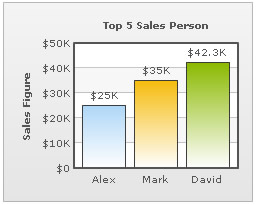
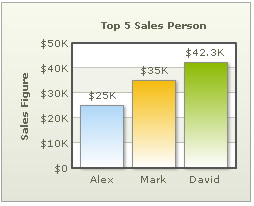
Shown below is a same chart with three different palette colors applied on it.
 |
 |
 |
Palette Set as 1 |
Palette Set as 2 |
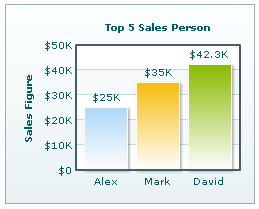
Palette Set as 3 |
As you can see in the images above, the various elements of chart have changed colors based on palette number. However, the data items do not change color, as internal palettes do not cover them.
You can however, specify your own palette for data items by providing a list of hex colors as under:
<chart yAxisName='Sales Figure' caption='Top 5 Sales Person' numberPrefix='$' paletteColors='FF5904,0372AB,FF0000'>
   <set label='Alex' value='25000' />
   <set label='Mark' value='35000' />
   <set label='David' value='42300' />
</chart>
{
  "chart":{
    "yaxisname":"Sales Figure",
    "caption":"Top 5 Sales Person",
    "numberprefix":"$",
    "palettecolors":"FF5904,0372AB,FF0000"
  },
  "data":[{
      "label":"Alex",
      "value":"25000"
    },
    {
      "label":"Mark",
      "value":"35000"
    },
    {
      "label":"David",
      "value":"42300"
    }
  ]
}
Here, 3 hex colors have been specified in paletteColors attribute. Since there are 3 columns in the chart, it results in following:
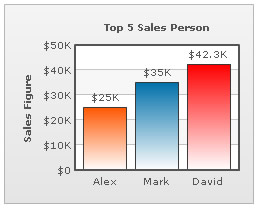
Had there been more columns, the colors would have been sequentially cycled for each of those columns. You can provide any number of colors as value of this attribute.
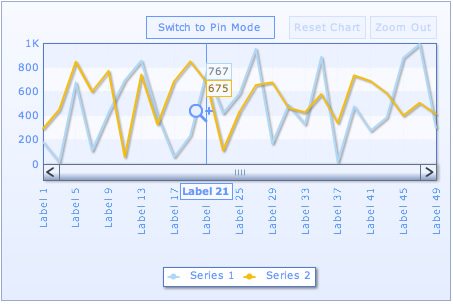
The Zoom Line Chart allows you to build the entire chart derived out a single color named palette theme color. The text, canvas, background, border, axis lines etc. are derived from this color. The data plots, however, still use the palette colors as described earlier. Palette theme color can be provided as under:
<chart paletteThemeColor='6699FF' ..>
Here, we've provided a shade of blue, which results in the chart as under. Note how everything has been automatically been converted to a shade of above specified blue.