Chart limits are the minimum & maximum y-axis values. FusionCharts automatically calculates the best chart limits when you don't specify them explicitly.
In FusionCharts, the axis limits encompasses all values present in the chart i.e., no data value can be below the minimum y-axis value or above maximum y-axis value - they have to be within axis range. Even if you force an axis limit that is lower/higher than this, FusionCharts will automatically adjust it.
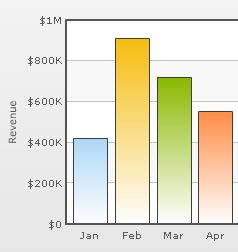
The XML/JSON code going into the above is:
<chart caption='Monthly Revenue' xAxisName='Month' yAxisName='Revenue' numberPrefix='$' showValues='0'>
     <set label='Jan' value='420000' />
     <set label='Feb' value='910000' />
     <set label='Mar' value='720000' />
     <set label='Apr' value='550000' />
     ....
</chart>
{
"chart":{
"caption":"Monthly Revenue",
"xaxisname":"Month",
"yaxisname":"Revenue",
"numberprefix":"$",
"showvalues":"0"
},
"data":[{
"label":"Jan",
"value":"420000"
},
{
"label":"Feb",
"value":"910000"
},
{
"label":"Mar",
"value":"720000"
},
{
"label":"Apr",
"value":"550000"
}
...
]
}
Note that the chart limits have not been defined.
You can set the chart limits explicitly using the yAxisMaxValue and yAxisMinValue attributes.
<chart yAxisMinValue='0' yAxisMaxValue='100' ...>
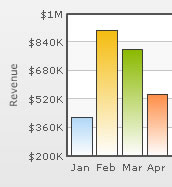
You can set whether the y-axis lower limit would be 0 (in case of all positive values on chart) or should the y-axis lower limit adapt itself to a different figure based on values provided to the chart.
<chart caption='Monthly Revenue' xAxisName='Month' yAxisName='Revenue' numberPrefix='$' showValues='0' setAdaptiveYMin='1' >
      <set label='Jan' value='420000' />
      <set label='Feb' value='910000' />
      <set label='Mar' value='720000' />
      <set label='Apr' value='550000' />
      ....
</chart>
Note the change in the y-axis minimum value now:
For charts that support dual Y Axis, you need to set axis limits for each axis as under:
<chart PYAxisMinValue='0' PYAxisMaxValue='100' SYAxisMinValue='10' SYAxisMaxValue='20' ..>
Here, PYAxisMinValue and PYAxisMaxValue refer to y-axis min value and max value of primary axis. SYAxisMinValue and SYAxisMaxValue refer to y-axis min and max value of secondary axis.
If you want both the axis of a dual y-axis chart to have same limits, you can set :
<chart syncAxisLimits='1' ..>
The Zoom Line chart supports dynamic axis i.e., the axis reflects limits that are pertinent to current view of zoom (if data has been zoomed in). So if the data items that are currently visible in zoomed mode range from 10-92, the axis will have limits of 0-100. However, if upon scrolling/zooming out, the data range changes from 18-991, then the axis will automatically be changed from 0-100. By default, dynamic axis is not enabled. To enable it, you set:
<chart dynamicAxis='1' ..>
This applies to both linear and log axis of Zoom Line Chart.