Each data point in a line/spline/area chart is represented by an anchor. The anchors help identify the data point better in the chart. They also show a tool tip showing the data point details when the mouse is hovered over them, and can be linked to other pages as well.
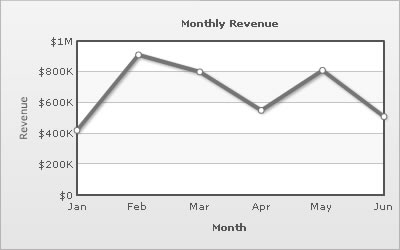
The data for the above is:
<chart caption='Monthly Revenue' xAxisName='Month' yAxisName='Revenue' numberPrefix='$' showValues='0'>
    <set label='Jan' value='420000' />
    <set label='Feb' value='910000' />
    <set label='Mar' value='800000' />
    <set label='Apr' value='550000' />
    <set label='May' value='810000' />
    <set label='Jun' value='510000' />
</chart>
{
  "chart":{
    "caption":"Monthly Revenue",
    "xaxisname":"Month",
    "yaxisname":"Revenue",
    "numberprefix":"$",
    "showvalues":"0"
  },
  "data":[{
      "label":"Jan",
      "value":"420000"
    },
    {
      "label":"Feb",
      "value":"910000"
    },
    {
      "label":"Mar",
      "value":"800000"
    },
    {
      "label":"Apr",
      "value":"550000"
    },
    {
      "label":"May",
      "value":"810000"
    },
    {
      "label":"Jun",
      "value":"510000"
    }
  ]
}
The anchors are displayed by default. To hide them, use the drawAnchors='0' attribute.
<chart drawAnchors='0' ...>
Once the anchors are hidden, the tool tips for the data points would not be displayed and the links would not work either.
If you need to hide the anchors but still have tool tip and link, use:
<chart anchorAlpha='0' ... >
The anchor looks can be customized using the following attributes:
| Attribute Name | Range | Description |
| anchorSides | 3-20 | This attribute sets the number of sides the anchor will have. For example, an anchor with 3 sides would represent a triangle, with 4 it would be a square and so on. |
| anchorRadius | In Pixels | This attribute sets the radius (in pixels) of the anchor. Greater the radius, bigger would be the anchor size. |
| anchorBorderColor | Hex Code | Lets you set the border color of anchors. |
| anchorBorderThickness | In Pixels | Helps you set border thickness of anchors. |
| anchorBgColor | Hex Code | Helps you set the background color of anchors. |
| anchorAlpha | 0-100 | Helps you set the alpha of entire anchors. If you need to hide the anchors on chart but still enable tool tips, set this as 0. |
| anchorBgAlpha | 0-100 | Helps you set the alpha of anchor background. |
In order to highlight a particular data point, you can define its anchor properties explicitly.
<chart caption='Monthly Revenue' xAxisName='Month' yAxisName='Revenue' numberPrefix='$' showValues='0'>
          <set label='Jan' value='420000' />
          <set label='Feb' value='910000' anchorSides='4' anchorRadius='6' anchorBgColor='666666' anchorBorderColor='CCCCCC' anchorBorderThickness='2'/>
          <set label='Mar' value='800000' />
          <set label='Apr' value='550000' />
          <set label='May' value='810000' />
          <set label='Jun' value='510000' />
</chart>
{
"chart":{
"caption":"Monthly Revenue",
"xaxisname":"Month",
"yaxisname":"Revenue",
"numberprefix":"$",
"showvalues":"0"
},
"data":[{
"label":"Jan",
"value":"420000"
},
{
"label":"Feb",
"value":"910000",
"anchorsides":"4",
"anchorradius":"6",
"anchorbgcolor":"666666",
"anchorbordercolor":"CCCCCC",
"anchorborderthickness":"2"
},
{
"label":"Mar",
"value":"800000"
},
{
"label":"Apr",
"value":"550000"
},
{
"label":"May",
"value":"810000"
},
{
"label":"Jun",
"value":"510000"
}
]
}
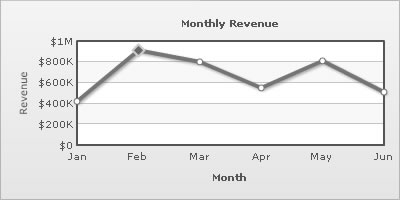
Note that the anchor for Feb has different properties than the other anchors.
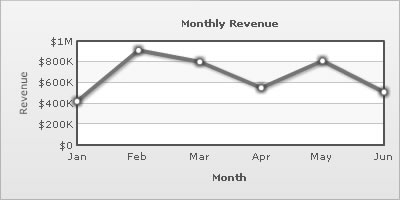
Using Styles, you can apply effects (shadow, glow, bevel, blur) to the anchors. Let us see how to provide a glow effect to the anchors.
<chart caption='Monthly Revenue' xAxisName='Month' yAxisName='Revenue' numberPrefix='$' showValues='0'>
    <set label='Jan' value='420000' />
    <set label='Feb' value='910000' />
    <set label='Mar' value='800000' />
    <set label='Apr' value='550000' />
    <set label='May' value='810000' />
    <set label='Jun' value='510000' />
    <styles>
        <definition>
            <style name='myGlow' type='glow' color='999999' />
        </definition>
        <application>
            <apply toObject='ANCHORS' styles='myGlow' />
        </application>
    </styles>
</chart>
{
  "chart":{
    "caption":"Monthly Revenue",
    "xaxisname":"Month",
    "yaxisname":"Revenue",
    "numberprefix":"$",
    "showvalues":"0"
  },
  "data":[{
      "label":"Jan",
      "value":"420000"
    },
    {
      "label":"Feb",
      "value":"910000"
    },
    {
      "label":"Mar",
      "value":"800000"
    },
    {
      "label":"Apr",
      "value":"550000"
    },
    {
      "label":"May",
      "value":"810000"
    },
    {
      "label":"Jun",
      "value":"510000"
    }
  ],
  "styles":[{
      "definition":[{
          "style":[{
              "name":"myGlow",
              "type":"glow",
              "color":"999999"
            }
          ]
        }
      ],
      "application":[{
          "apply":[{
              "toobject":"ANCHORS",
              "styles":"myGlow"
            }
          ]
        }
      ]
    }
  ]
}
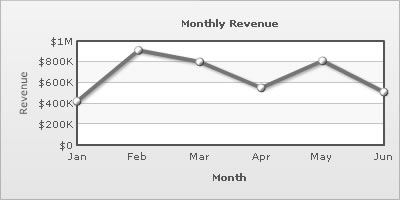
To provide a bevel effect to the anchors, we have the following data:
<chart caption='Monthly Revenue' xAxisName='Month' yAxisName='Revenue' numberPrefix='$' showValues='0' anchorradius='4' >
     <set label='Jan' value='420000' />
     <set label='Feb' value='910000' />
     <set label='Mar' value='800000' />
     <set label='Apr' value='550000' />
     <set label='May' value='810000' />
     <set label='Jun' value='510000' />
     <styles>
        <definition>
           <style name='myBevel' type='bevel' distance='2' />
        </definition>
        <application>
           <apply toObject='ANCHORS' styles='myBevel' />
        </application>
     </styles>
</chart>
{
"chart":{
"caption":"Monthly Revenue",
"xaxisname":"Month",
"yaxisname":"Revenue",
"numberprefix":"$",
"showvalues":"0",
"anchorradius":"4"
},
"data":[{
"label":"Jan",
"value":"420000"
},
{
"label":"Feb",
"value":"910000"
},
{
"label":"Mar",
"value":"800000"
},
{
"label":"Apr",
"value":"550000"
},
{
"label":"May",
"value":"810000"
},
{
"label":"Jun",
"value":"510000"
}
],
"styles":[{
"definition":[{
"style":[{
"name":"myBevel",
"type":"bevel",
"distance":"2"
}
]
}
],
"application":[{
"apply":[{
"toobject":"ANCHORS",
"styles":"myBevel"
}
]
}
]
}
]
}
The anchors can be animated using STYLES. In the example below, we provide a bouncing effect to the anchors.
<chart caption='Monthly Revenue' xAxisName='Month' yAxisName='Revenue' numberPrefix='$' showValues='0' anchorradius='4' >
    <set label='Jan' value='420000' />
    <set label='Feb' value='910000' />
    <set label='Mar' value='800000' />
    <set label='Apr' value='550000' />
    <set label='May' value='810000' />
    <set label='Jun' value='510000' />
    <styles>
        <definition>
            <style name='myAnim' type='animation' param='_y' start='0' easing='Bounce' duration='1'/>
        </definition>
        <application>
            <apply toObject='ANCHORS' styles='myAnim' />
        </application>
    </styles>
</chart>
{
"chart":{
"caption":"Monthly Revenue",
"xaxisname":"Month",
"yaxisname":"Revenue",
"numberprefix":"$",
"showvalues":"0",
"anchorradius":"4"
},
"data":[{
"label":"Jan",
"value":"420000"
},
{
"label":"Feb",
"value":"910000"
},
{
"label":"Mar",
"value":"800000"
},
{
"label":"Apr",
"value":"550000"
},
{
"label":"May",
"value":"810000"
},
{
"label":"Jun",
"value":"510000"
}
],
"styles":[{
"definition":[{
"style":[{
"name":"myAnim",
"type":"animation",
"param":"_y",
"start":"0",
"easing":"Bounce",
"duration":"1"
}
]
}
],
"application":[{
"apply":[{
"toobject":"ANCHORS",
"styles":"myAnim"
}
]
}
]
}
]
}