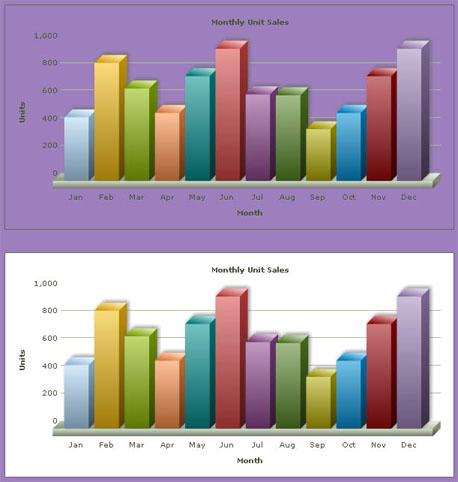
In the previous section we discussed the basics of using FusionCharts with ASP. In the current section, we will see how we can make the charts transparent. We will extend our previous example and only add a few more lines of code to make the chart transparent.
We will build two Column 3D charts, both using the same data-source. We take the existing SimpleChart.asp and Data.xml (present in Data folder) and modify these to achieve our goal. We modify SimpleChart.asp to render two column 3D charts.
Let's first have a look at the modified code for SimpleChart.asp: ( We save the it as SimpleChart_Transparent.asp)
<%@ Language=VBScript %>
  <HTML>
     <HEAD>
        <TITLE>FusionCharts - Simple Column 3D Chart</TITLE>
     </HEAD>
     <!-- #INCLUDE FILE="../Includes/FusionCharts.asp" -->
     <BODY>
         <div style="padding:40px; background-color:#9d7fbd; border:1px solid #745C92; width: 600px;">
         <%
         ' Set the chart mode transparent. This would affect all the charts
         ' Rendered after this declaration.
         Call SetTransparentChart(True)
         ' render chart : This would be a transparent chart
         Call renderChart("../../FusionCharts/Column3D.swf", "Data/Data_Transparent.xml", "",
                          "myFirst_Transparent", 600, 300, false, false)
              %>
      <BR /><BR />
      <%
         ' Set the chart mode opaque. This would affect all the charts
         ' Rendered after this declaration.
                 Call SetTransparentChart(False)
         ' Render chart : This would be an opaque chart
         Call renderChart("../../FusionCharts/Column3D.swf", "Data/Data_Transparent.xml", "",
                          "myFirst_Opaque", 600, 300, false, false)
              %>
           </div>
        </BODY>
  </HTML>
As you can see above, we did the following:
- We've first called SetTransparentChart(true). This sets the subsequent chart to transparent mode. By transparent mode, it means that now the chart is prepared to be in transparent mode. Hence , the first chart rendered after this call would be rendered in transparent mode.
- We again called SetTransparentChart(false).This statement sets all subsequent charts to opaque mode. By opaque mode, it means that the chart can no longer be rendered transparent.
- Moreover, we have placed the charts inside a purple colored container to make sure that the charts rendered are truly transparent or not.
As you have noticed, we have used Data_Transparent.xml file as the dataURL source for both the charts. We did a little modification to the existing Data.xml file to set the background of the chart transparent and saved it as Data_Transparent.xml.
Let us have a look at the modified XML:
<chart caption='Monthly Unit Sales' xAxisName='Month' yAxisName='Units'
       showValues='0' formatNumberScale='0' showBorder='1' canvasBgAlpha='0' bgAlpha='0'>
      <set label='Jan' value='462' />
      <set label='Feb' value='857' />
      <set label='Mar' value='671' />
      <set label='Apr' value='494' />
      <set label='May' value='761' />
      <set label='Jun' value='960' />
      <set label='Jul' value='629' />
      <set label='Aug' value='622' />
      <set label='Sep' value='376' />
      <set label='Oct' value='494' />
      <set label='Nov' value='761' />
      <set label='Dec' value='960' />
 </chart>
This XML is identical to our previous SimpleChart.asp example except for the bgAlpha and canvasBgAlpha attributes. bgAlpha sets the opacity of the chart's main background while canvasBgAlpha sets the opacity of the chart's 3D canvas. The attributes are set to 0 to declare full transparency.
The resultant charts would look as follows:
