Let's create a grid chart that will visually depict the Weekly Sales of a fictitious shop. The sample data that we intend to plot can be tabularized as under:
| Week | Previous Month (sales) |
| Week 1 | $40800 |
| Week 2 | $31400 |
| Week 3 | $26700 |
| Week 4 | $54400 |
| Week 5 | $88544 |
| Week 6 | $22544 |
| Week 7 | $65548 |
Let's see how to use FusionCharts ASP Class to plot this data into a Grid chart:
<%@LANGUAGE="VBSCRIPT"%>
 <%
    'Include FusionCharts ASP Class
%>
<!--#include file="../Class/FusionCharts_Gen.asp"-->
<%
    dim FC
    ' Create FusionCharts ASP class object
    set FC = new FusionCharts
    ' Set chart type to Grid
    Call FC.setChartType("grid")
    ' Set chart size
    Call FC.setSize("300","200")
    ' Set the relative path of the SWF file
    Call FC.setSWFPath("../FusionCharts/")
    ' Set grid value Percent on
    Call FC.setGridParams("showPercentValues=1")
    ' Set alternate row back ground color
    Call FC.setGridParams("alternateRowBgColor=EAECEF")
    ' number item per page
    Call FC.setGridParams("numberItemsPerPage=4")
    ' set grid font and font size
    Call FC.setGridParams("baseFont=Verdana")
    Call FC.setGridParams("baseFontSize=12")
    ' Add chart values and category names
    Call FC.addChartData("40800","label=Week 1","")
    Call FC.addChartData("31400","label=Week 2","")
    Call FC.addChartData("26700","label=Week 3","")
    Call FC.addChartData("54400","label=Week 4","")
    Call FC.addChartData("88544","label=Week 5","")
    Call FC.addChartData("22544","label=Week 6","")
    Call FC.addChartData("65548","label=Week 7","")
   %>
  <html>
      <head>
         <title>SSGrid with ASP Class</title>
         <script language='javascript' src='../FusionCharts/FusionCharts.js'></script>
      </head>
      <body>
            <%
               ' Render Grid
                FC.renderChart(false)
            %>
      </body>
 </html>
Let's analyze the steps involved in the above code:
- We include FusionCharts_Gen.asp in the program. This file contains FusionCharts ASP Class codes.
<!--#include file="../Class/FusionCharts_Gen.asp"-->
- We create a chart object.
set FC = new FusionCharts
- We specify the chart type.
Call FC.setChartType("grid")
- We specify the size of the chart.
Call FC.setSize("300","200")
- Next, we set relative path to the chart SWF files using setSwfPath() function. This is the path from which we load the chart SWF files.
Call FC.setSWFPath("../FusionCharts/")
- Hereby, we use setGridParams() to set grid chart parameters(attributes) (Note that for Grid chart it is necessary to use this function instead of setChartParam() or setChartParams(). In the following line, we set font face and font size of the grid. The two attributes are separated by delimiters.
Call FC.setGridParams("baseFont=Verdana;baseFontSize=12")
- Then, we set to show the grid values as percentage.
Call FC.setGridParams("showPercentValues=1")
- Next, we set background color of alternate data rows.
Call FC.setGridParams("alternateRowBgColor=EAECEF")
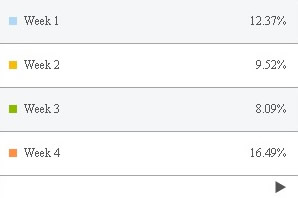
- Then, we set the number of data items that we want to display in one particular page. We set the no. of items per page to 4. In the following chart, the first page will display four data and the next page will display the remaining three data items.
Call FC.setGridParams("numberItemsPerPage=4");
- Now, we provide chart data through addChartData() function. We pass the value first, and then, the category name against each value as a parameter i.e., label=Week 1 etc.
 Call FC.addChartData("40800","label=Week 1","")
 Call FC.addChartData("31400","label=Week 2","")
 Call FC.addChartData("26700","label=Week 3","")
 Call FC.addChartData("54400","label=Week 4","")
 Call FC.addChartData("88544","label=Week 5","")
 Call FC.addChartData("22544","label=Week 6","")
 Call FC.addChartData("65548","label=Week 7","")
- Finally, we include FusionCharts.js - FusionCharts JavaScript Embedding Class and
- Display the chart using renderChart() function.
Call FC.renderChart(false);
Here is the Grid chart displaying the first page with four data items that the FusionCharts ASP Class renders:
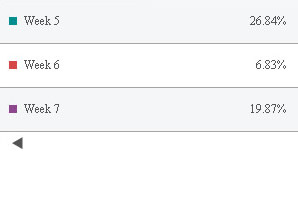
To see the remaining data items that reside on the next page, we have to click on the arrow(button) lying at the bottom of first page. Then, we will see the next page as shown in the image below :