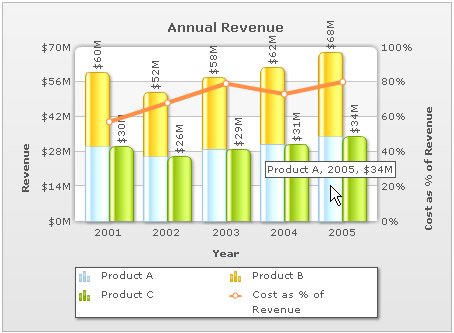
In this section we will show you how to create a complex chart - Multi-series Stacked 2D Line Dual Y Chart. Here we calculate the cost as Percentage of Revenue for three products A, B and C.
Let's examine the following data for a multi-series Stacked 2D Line Dual Y chart.
| Year |
Product A(1) |
Product A(2) |
Product B |
Cost as % of Revenue |
| 2001 | 30 | 30 | 30 | 57 |
| 2002 | 26 | 26 | 26 | 68 |
| 2003 | 29 | 29 | 29 | 79 |
| 2004 | 31 | 31 | 31 | 73 |
| 2005 | 34 | 34 | 34 | 80 |
The chart that would be created using this data would look like the image shown below:
Here we need to create:
- One primary dataset to stack up Revenue values for Product A(1) and Product A(2). The values would be scaled to the Primary Y Axis on the left.
- Another primary dataset to show Revenue values for Product B. The values would be scaled to the Primary Y Axis on the left.
- A lineset which would be automatically mapped to Secondary Y Axis.
Before you go further with this page, we recommend you to please see the previous page Creating First Chart as we start off from concepts explained in that page.
Let's go through the code that builds this chart:
<%@LANGUAGE="VBSCRIPT"%>
  <%
     ' Include FusionCharts ASP Class
  %>
<!--#include file="../Class/FusionCharts_Gen.asp"-->
  <%
dim FC
    ' Create FusionCharts ASP class object
set FC = new FusionCharts
    ' Set chart type to Multiseries Stacked Column2D Line DY
Call FC.setChartType("MSStackedColumn2DLineDY")
    ' Set chart size
Call FC.setSize("450","350")
    ' Set the relative path of the SWF file
Call FC.setSWFPath("../FusionCharts/")
     dim strParam
         ' Define chart attributes
           strParam="caption=Annual Revenue;rotateValues =1;xAxisName=Year;PYAxisName=Revenue;
           SYAXisName=Cost as %25 of Revenue;numberPrefix=$;numberSuffix=M;sNumberSuffix=%25;
           SYAxisMinValue=0;SYAxisMaxValue=100;showValues=0;useRoundEdges=1;showSum=1"
        ' Set chart attributes
          Call FC.setChartParams(strParam)
        ' Add category names
          Call FC.addCategory("2001","","")
          Call FC.addCategory("2002","","")
          Call FC.addCategory("2003","","")
          Call FC.addCategory("2004","","")
          Call FC.addCategory("2005","","")
        ' Add Multi-series Dataset
          Call FC.createMSStDataset()
        ' Add Multi-series dataset with in dataset
          Call FC.addMSStSubDataset("Product A", "")
        ' Add set data for plotting the chart
          Call FC.addChartData("30","","")
          Call FC.addChartData("26","","")
          Call FC.addChartData("29","","")
          Call FC.addChartData("31","","")
          Call FC.addChartData("34","","")
        ' Add Next Multi-series dataset with in dataset
          Call FC.addMSStSubDataset("Product B", "")
        ' Add set data for plotting the chart
          Call FC.addChartData("30","","")
          Call FC.addChartData("26","","")
          Call FC.addChartData("29","","")
          Call FC.addChartData("31","","")
          Call FC.addChartData("34","","")
        ' Add Multi-series  Dataset
          Call FC.createMSStDataset()
        ' Add Multi-series dataset with in dataset
          Call FC.addMSStSubDataset("Product C", "")
        ' Add set data for plotting the chart
          Call FC.addChartData("30","","")
          Call FC.addChartData("26","","")
          Call FC.addChartData("29","","")
          Call FC.addChartData("31","","")
          Call FC.addChartData("34","","")
        ' Add Multi-series lineset for showing lines
          Call FC.addMSLineset("Cost as %25 of Revenue","lineThickness=4")
        ' Add set data with in lineset
          Call FC.addMSLinesetData("57","","")
          Call FC.addMSLinesetData("68","","")
          Call FC.addMSLinesetData("79","","")
          Call FC.addMSLinesetData("73","","")
          Call FC.addMSLinesetData("80","","")
     %>
      <html>
       <head>
         <title>Multiseries Stacked Column2D Line DY Chart Using FusionCharts ASP Class</title>
         <script language='javascript' src='../FusionCharts/FusionCharts.js'></script>
       </head>
       <body>
            <%
               ' Render Chart with JS embedding Method
                Call FC.renderChart(false)
            %>
       </body>
      </html>
As you can see in the above code, we're doing the following:
- We include FusionCharts_Gen.asp.
- We create an object for Multiseries Stacked Column2D Line DY chart and set relative file path to the SWF file.
set FC = new FusionCharts
Call FC.setChartType("MSStackedColumn2DLineDY")
Call FC.setSize("450","350")
Call FC.setSWFPath("../FusionCharts/")
- We store chart attributes in strParam variable and pass it to setChartParams() function. It sets the chart attributes.
- Next, we add the category names separately using addCategory() function.
Call FC.addCategory("2001","","")
Call FC.addCategory("2002","","")
Call FC.addCategory("2003","","")
Call FC.addCategory("2004","","")
Call FC.addCategory("2005","","")
- Let us now create the primary dataset and sub-datasets for Primary Y Axis.
For this, we first create a multi-series primary dataset using createMSStDataset()for multi-series stacked column 2D line DY chart. Please note that all multi-series primary datasets would be mapped to Primary Y Axis on the left.
Call FC.createMSStDataset()
- We add Multi-series sub-dataset within the primary dataset declared above. We use addMSStSubDataset() to do the task. It takes two parameters. First parameter takes the series name. The second parameter can take delimiter dataset attributes which we have kept blank in this example.
Call FC.addMSStSubDataset("Product A", "")
- We provide chart data specific to the above dataset. Remember to provide chart data just after the dataset is defined.
Call FC.addChartData("30","","")
Call FC.addChartData("26","","")
Call FC.addChartData("29","","")
Call FC.addChartData("31","","")
Call FC.addChartData("34","","")
Please note that as we have 5 categories, we have entered 5 values for the dataset 'Product A'.
- Likewise, we create another sub-dataset for product B and provide the data values.
Call FC.addMSStSubDataset("Product B", "")
Call FC.addChartData("30","","")
Call FC.addChartData("26","","")
Call FC.addChartData("29","","")
Call FC.addChartData("31","","")
Call FC.addChartData("34","","")
- We again create another primary dataset and add a sub-dataset for Product C and add respective data values.
Call FC.createMSStDataset()
Call FC.addMSStSubDataset("Product C", "")
Call FC.addChartData("30","","")
Call FC.addChartData("26","","")
Call FC.addChartData("29","","")
Call FC.addChartData("31","","")
Call FC.addChartData("34","","")
- Now, we create a lineset. All linesets would be automatically mapped to Secondary Y Axis. You can create any number of linesets using this process.
Call FC.addMSLineset("Cost as % of Revenue","lineThickness=4")
- Next, we add data to the lineset using addMSLinesetData().
Call FC.addMSLinesetData("57","","")
Call FC.addMSLinesetData("68","","")
Call FC.addMSLinesetData("79","","")
Call FC.addMSLinesetData("73","","")
Call FC.addMSLinesetData("80","","")
- We add FusionCharts.js.
- Finally, we render the chart.
Call FC.renderChart(false)
And the Multi-series Stacked 2D Line Dual Y chart is ready!