In our previous example, we had used FusionCharts to plot a chart using data stored in database. We'll now extend that example itself to create a drill-down chart which can show more information.
Before you go further with this page, we recommend you to please see the previous sections like "Basic Examples", Creating Data from Array" as we start off from concepts explained in those pages.
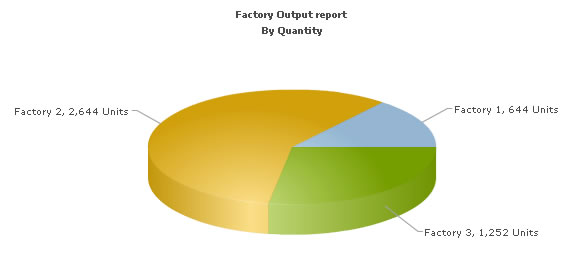
If you recall from previous example, we were showing the sum of factory output in a Pie chart as under:
The code examples contained in this page are contained in Download Package > Code > ASPClass > DB_DrillDown folder.
<%@LANGUAGE="VBSCRIPT"%>
<% option explicit %>
<%
' We've included ../Includes/FusionCharts_Gen.asp, which contains
' FusionCharts ASP Class to help us easily embed charts
' We've also used ../Includes/DBConn.asp to easily connect to a database
%>
<!--#include file="../Includes/DBConn.asp"-->
<!--#include file="../Includes/FusionCharts_Gen.asp"-->
<HTML>
<HEAD>
<TITLE>FusionCharts V3 - Database and Drill-Down Example</TITLE>
<%
'You need to include the following JS file, if you intend to embed the chart using JavaScript.
'Embedding using JavaScripts avoids the "Click to Activate..." issue in Internet Explorer
'When you make your own charts, make sure that the path to this JS file is correct. Else,
'you would get JavaScript errors.
%>
<SCRIPT LANGUAGE="Javascript" SRC="../../FusionCharts/FusionCharts.js"></SCRIPT>
</HEAD>
<BODY>
<h4>Click on any pie slice to see detailed data.</h4>
<%
'In this example, we show how to connect FusionCharts to a database.
'For the sake of ease, we've used an MySQL databases containing two
'tables.
dim FC
' Create FusionCharts ASP class object
set FC = new FusionCharts
' Set chart type to Pie 3D
Call FC.setChartType("Pie3D")
' Set chart size
Call FC.setSize("650","450")
' Set Relative Path of SWF file.
Call FC.setSWFPath("../../FusionCharts/")
dim strParam
' Define chart attributes
strParam="caption=Factory Output report;subCaption=By Quantity;pieSliceDepth=30;numberSuffix= Units;decimals=0"
' Set chart attributes
Call FC.setChartParams(strParam)
' Fetch all factory records creating SQL query
dim strQuery
strQuery = "select a.FactoryID, b.FactoryName, sum(a.Quantity) as total from Factory_output a, Factory_Master b where a.FactoryId=b.FactoryId group by a.FactoryId,b.FactoryName"
Dim oRs
'Create the recordset to retrieve data
Set oRs = Server.CreateObject("ADODB.Recordset")
Set oRs = oConn.Execute(strQuery)
'Pass the SQL query result and Drill-Down link format to ASP Class Function
'this function will automatically add chart data from database
'The last parameter passed i.e., "Detailed.asp?FactoryId=##FactoryID##"
'drill down link from the current chart
'Here, the link redirects to another ASP file Detailed.asp
'with a query string variable -FactoryId
'whose value would be taken from the Query result created above.
'Any thing placed between ## and ## will be regarded
'as a field/column name in the SQL query result.
'value from that column will be assigned as the query variable's value
'Hence, for each dataplot in the chart the resultant query variable's value
'will be different
if Not oRs.Bof then
Call FC.addDataFromDatabase(oRs, "total", "FactoryName","","Detailed.asp?FactoryId=##FactoryID##")
End If
oRs.Close
set oRs=Nothing
'Create the chart
Call FC.renderChart(false)
%>
</BODY>
</HTML>
- Include FusionCharts.js JavaScript class, and FusionCharts_Gen.asp to enable easy embedding of FusionCharts. DBConn.asp contains connection parameters to connect to database.
- Create FusionCharts ASP class object for Pie 3D chart.
- Set relative path of chart SWF file.
- Store chart attributes in a variable strParam.
- Set chart attributes using setChartParams() function.
- Fetch required records from database and store the output in oRs recordset.
- Call addDataFromDatabase() function to add chart data from database; we specify the link attribute which points to Detailed.asp page that contains the chart to show details.The last parameter passed i.e., "Detailed.asp?FactoryId=##FactoryID##" drill down link from the current chart. Here, the link redirects to another ASP file Detailed.asp with a querystring variable -FactoryId whose value would be taken from the Query result created above. Any thing placed between ## and ## will be regarded as a field/column name in the SQL query result. Value from that column will be dynamically assigned as the query variable's value. Hence, for each dataplot in the chart the resultant query variable's value will be different.
- Close database link.
- Render chart .
<%@LANGUAGE="VBSCRIPT"%>
<% option explicit %>
<%
'We've included ../Includes/FusionCharts_Gen.asp, which contains
'FusionCharts ASP Class to help us easily embed charts
'We've also used ../Includes/DBConn.asp to easily connect to a database
%>
<!--#include file="../Includes/DBConn.asp"-->
<!--#include file="../Includes/FusionCharts_Gen.asp"-->
<HTML>
<HEAD>
<TITLE>
FusionCharts V3 - Database and Drill-Down Example
</TITLE>
<%
'You need to include the following JS file, if you intend to embed the chart using JavaScript.
'Embedding using JavaScripts avoids the "Click to Activate..." issue in Internet Explorer
'When you make your own charts, make sure that the path to this JS file is correct. Else, you would get JavaScript errors.
%>
<SCRIPT LANGUAGE="Javascript" SRC="../../FusionCharts/FusionCharts.js"></SCRIPT>
</HEAD>
<BODY>
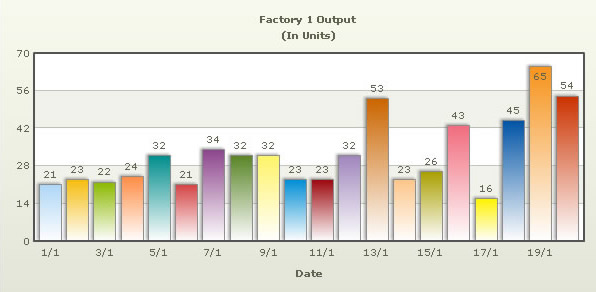
<h4>Detailed report for the factory</h4>
<%
'This page is invoked from Default.asp. When the user clicks on a pie
'slice in Default.asp, the factory Id is passed to this page. We need
'to get that factory id, get information from database and then show
'a detailed chart.
'Request the factory Id from Querystring
dim FactoryId
FactoryId = Request("FactoryId")
dim FC
' Create FusionCharts ASP class object
set FC = new FusionCharts
' Set chart type to Column 2D
Call FC.setChartType("Column2D")
' Set chart size
Call FC.setSize("600","300")
' Set Relative Path of SWF file.
Call FC.setSWFPath("../../FusionCharts/")
dim strParam
' Define chart attributes
strParam="caption=Factory " & FactoryId & " Output;subcaption=(In Units);xAxisName=Date;labelStep=2"
' Set chart attributes
Call FC.setChartParams(strParam)
'Now, we get the data for that factory
'storing chart values in 'Quantity' column and category names in 'DDate'
dim strQuery
strQuery = "select Quantity, format(DatePro,'dd/MM/yyyy') as DDate from Factory_Output where FactoryId=" & FactoryId
'For SQL Server 2000 Query
'strQuery = "select Quantity, convert(varchar,DatePro,103) as DDate from Factory_Output where FactoryId=" & FactoryId
Dim oRs
'Create the recordset to retrieve data
Set oRs = Server.CreateObject("ADODB.Recordset")
Set oRs = oConn.Execute(strQuery)
'Pass the SQL query result to the FusionCharts ASP Class' function
'that will extract data from database and add to the chart.
if not oRs.bof then
Call FC.addDataFromDatabase(oRs, "Quantity", "DDate","","")
end if
oRs.Close
set oRs=Nothing
'Create the chart
Call FC.renderChart(false)
%>
</BODY>
</HTML>
- Including FusionCharts.js JavaScript class, and FusionCharts_Gen.asp to enable easy embedding of FusionCharts.
- Requesting the factory id for which we've to show detailed data. This data was sent to us as query string, as a part of pie chart link. FactoryId is stored in a variable FactoryId.
- Creating FusionCharts ASP class object for Column 2D chart.
- Setting relative path of chart SWF file.
- Storing chart attributes in a variable strParam.
- Setting chart attributes through setChartParams() function.
- Connecting to database through connectToDB() function.
- Fetching required data from database and storing in a variable $result.
- Passing result to addDataFromDatabase() function that adds chart data from database.
- Closing database connection.
- Rendering chart.