FusionCharts can effectively be used with ASP to plot dynamic data-driven charts. With FusionCharts ASP Class chart rendering becomes even easier. Let's see how to make use of FusionCharts ASP Class functions and create charts in few easy steps.
We'll cover the following examples here:
- Creating a simple chart using FusionCharts ASP Class
- Creating a chart with external XML file created using FusionCharts ASP Class
Let's quickly see each of them. Before you proceed with the contents in this page, we strictly recommend you to please go through the section How FusionCharts works?.
In our code, we've used the charts and FusionCharts.js contained in Download Package > Code > FusionCharts folder. We have kept FusionCharts_Gen.asp in Download Package > Code > ASPClass > Includes folder. When you run your samples, you need to make sure that all the files are in proper location.
Let's now start building our first chart. In this example, we'll create a "Monthly Unit Sales" chart.
<%@LANGUAGE="VBSCRIPT"%>
  <% option explicit %>
   <%
      'We've included ../Includes/FusionCharts_Gen.asp, which contains FusionCharts ASP Class
      'to help us easily embed the charts.
   %>
<!--#include file="../Includes/FusionCharts_Gen.asp"-->
<HTML>
     <HEAD>
         <TITLE>FusionCharts V3 - Simple Column 3D Chart</TITLE>
         <%
            'You need to include the following JS file, if you intend to embed the chart using JavaScript.
            'Embedding using JavaScripts avoids the "Click to Activate..." issue in Internet Explorer
            'When you make your own charts, make sure that the path to this JS file is correct. Else, you would get JavaScript errors.
         %>
         <SCRIPT LANGUAGE="Javascript" SRC="../../FusionCharts/FusionCharts.js"></SCRIPT>
      </HEAD>
      <BODY>
         <h4>Simple Column 3D Chart</h4>
               <%
                'This page demonstrates the ease of generating charts using FusionCharts ASPClass.
                'For this chart, we've created a chart  object used FusionCharts ASP Class
                'supply chart data and configurations to it and render chart using the instance
                'Here, we've kept this example very simple.
                dim FC
                'Create FusionCharts ASP class object
                set FC = new FusionCharts
                ' Set chart type to Column 3D
                call FC.setChartType("Column3D")
                ' Set chart size
                 call FC.setSize("600","300")
                ' Set Relative Path of SWF file.
                 Call FC.setSWFPath("../../FusionCharts/")
                 dim strParam
                ' Define chart attributes
                strParam="caption=Monthly Unit Sales;xAxisName=Month;yAxisName=Units"
                ' Set Chart attributes
                 Call FC.setChartParams(strParam)
                ' Add chart data values and category names
                 Call FC.addChartData("462","label=Jan","")
                 Call FC.addChartData("857","label=Feb","")
                 Call FC.addChartData("671","label=Mar","")
                 Call FC.addChartData("494","label=Apr","")
                 Call FC.addChartData("761","label=May","")
                 Call FC.addChartData("960","label=Jun","")
                 Call FC.addChartData("629","label=Jul","")
                 Call FC.addChartData("622","label=Aug","")
                 Call FC.addChartData("376","label=Sep","")
                 Call FC.addChartData("494","label=Oct","")
                 Call FC.addChartData("761","label=Nov","")
                 Call FC.addChartData("960","label=Dec","")
                ' Render Chart with JS Embedded Method
                 Call FC.renderChart(false)
              %>
       </BODY>
</HTML>
What we did in this program?
- Included FusionCharts_Gen.asp class and FusionCharts.js class,
- Created FusionCharts ASP class object FC for a Column 3D chart with 600 pixels width and 300 pixels height,
- Set relative path of chart SWF file using setSwfPath,
- Stored delimiter separated chart attributes in a variable strParam,
- Set these chart attributes to our chart using setChartParams,
- Added chart values and category names that are to be plotted on the Column 3D chart ,
- Finally rendered the chart using renderChart.
Please go through FusionCharts ASP Class API Reference section to know more about the functions used in the above code.
When you now run this page, you'll see a chart like the one below.
If you do not see a chart like the one below, please follow the steps listed in Debugging your Charts section of this documentation.
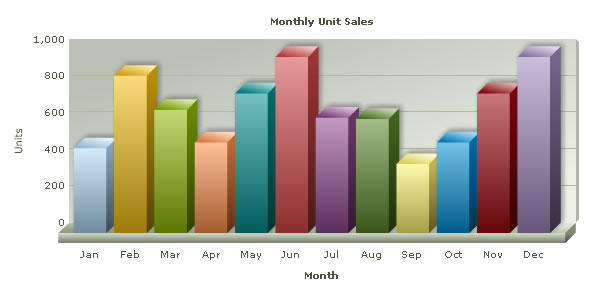
So, you just saw how simple it is to create a chart using FusionCharts ASP Class functions.
Now, we will create the same chart in a different way. Here, we will be using two different programs. One program creates the chart XML using FusionCharts ASP Class and the other uses this XML to render the chart using dataURL method. Code written inside Data.asp file creates the XML and SimpleChart.asp file uses the XML to render chart.
Let's consider the code in Data.asp file first. This code is similar like the code in the above example; the only difference is it does not render the chart but streams XML to SimpleChart.asp file.
<%@LANGUAGE="VBSCRIPT"%>
      <% option explicit %>
      <%
         'We've included ../../Includes/FusionCharts_Gen.asp - FusionCharts ASP Class
         'to help us easily embed the charts.
      %>
<!--#include file="../../Includes/FusionCharts_Gen.asp"-->
    <%
    'This page demonstrates the ease of generating charts using FusionCharts ASPClass.
    'We created a FusionCharts object instance
    'Set chart values and configurations and returns the XML using getXML() function
    'and write it to the response stream to build the XML
    'Here, we've kept this example very simple.
      dim FC
     ' Create FusionCharts ASP class object
      set FC = new FusionCharts
     ' Set chart type to column 3d
      call FC.setChartType("column3D")
      dim strParam
     ' Define chart attributes
      strParam="caption=Monthly Unit Sales;xAxisName=Month;yAxisName=Units;decimals=0; formatNumberScale=0;showLabels=1"
     ' Set chart attributes
      call FC.setChartParams(strParam)
     ' Add chart data values and category names
      call FC.addChartData("462","label=Jan","")
      call FC.addChartData("857","label=Feb","")
      call FC.addChartData("671","label=Mar","")
      call FC.addChartData("494","label=Apr","")
      call FC.addChartData("761","label=May","")
      call FC.addChartData("960","label=Jun","")
      call FC.addChartData("629","label=Jul","")
      call FC.addChartData("622","label=Aug","")
      call FC.addChartData("376","label=Sep","")
      call FC.addChartData("494","label=Oct","")
      call FC.addChartData("761","label=Nov","")
      call FC.addChartData("960","label=Dec","")
     'set content type as XML
      Response.ContentType ="text/xml"
     'Return the chart XML for Column 3D Chart
      Response.Write(FC.getXML())
    %>
What we did here:
- Included FusionCharts_Gen.asp class and FusionCharts.js class,
- Created FusionCharts ASP class object FC for a Column 3D chart with 600 pixels width and 300 pixels height,
- Set relative path of chart SWF file,
- Stored delimiter separated chart attributes in a variable strParam,
- Set these chart attributes to our chart,
- Added chart data that are to be plotted on the Column 3D chart,
- Finally returned the XML and wrote it to the response stream.
Let's now look at SimpleChart.asp function:
<%@LANGUAGE="VBSCRIPT"%>
  <% option explicit %>
  <%
     'We've included ../Includes/FusionCharts.asp, which contains functions
     'to help us easily embed the charts.
  %>
  <!--#include file="../Includes/FusionCharts.asp"-->
   <HTML>
       <HEAD>
         <TITLE>FusionCharts V3 - Simple Column 3D Chart using dataURL method</TITLE>
         <%
                'You need to include the following JS file, if you intend to embed the chart using JavaScript.
                'Embedding using JavaScripts avoids the "Click to Activate..." issue in Internet Explorer
                'When you make your own charts, make sure that the path to this JS file is correct. Else, you
                'would get JavaScript errors.
         %>
         <SCRIPT LANGUAGE="Javascript" SRC="../../FusionCharts/FusionCharts.js"></SCRIPT>
      </HEAD>
      <BODY>
         <h4>Simple Column 3D Chart using dataURL method</h4>
       <%
         'This page demonstrates the ease of generating charts using FusionCharts ASP Class.
         'For this chart, we've used a Data.asp which uses FusionCharts ASP Class (contained in /Data/ folder)
         'This file will generate the chart  XML and pass it to the chart
         'We will use FusionCharts ASP function - renderChart() to render the chart using the XML
         'For a head-start, we've kept this example very simple.
         'Create the chart - Column 3D Chart with data from Data/Data.xml
         Response.Write(renderChart("../../FusionCharts/Column3D.swf",
         "Data/Data.asp", "", "myFirst", 600, 300, false, false,false))
       %>
    </BODY>
</HTML>
Steps involved in this function:
- Include FusionCharts.js class and FusionCharts.asp wrapper classes.
- Call renderChart() function with data from Data.asp function.
Note: The renderChart() function used in this code is not the same with the one we used in the previous example, though they bear same name. This is FusionCharts ASP chart embedding function; please go through Using with ASP > Basic Examples to know more about it.
Here is the output. As you can see, the same chart has been created but in a different way.