Changed Behavior
This section is for users who are using previous version of FusionCharts in their application. Here we'll talk about the change in behavior of the charts after v3.14.0.
Top plot border of an area chart
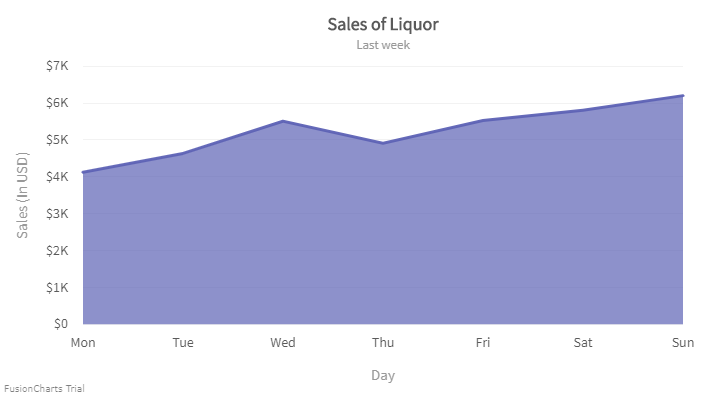
In area charts, you can now draw the borders of the data plots only at the top of an area plot.
The image below shows the border only at the top of an area plot.

To know more click here.
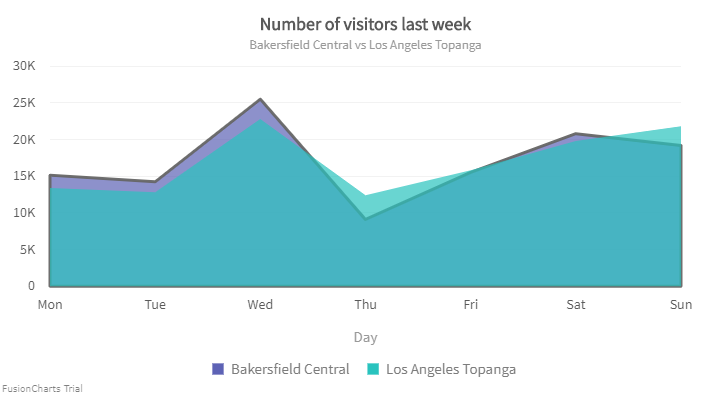
You can also configure the top border of a particular data plot in an area chart with multiple data plots.
Take a look at the image given below:

To know more click here.
Inherit plot border color of an area chart
FusionCharts Suite now allows you to set the border color of the area chart by inheriting the plot color.
The chart looks like as shown below:
Click here to know more.
Set the radius as a percent value
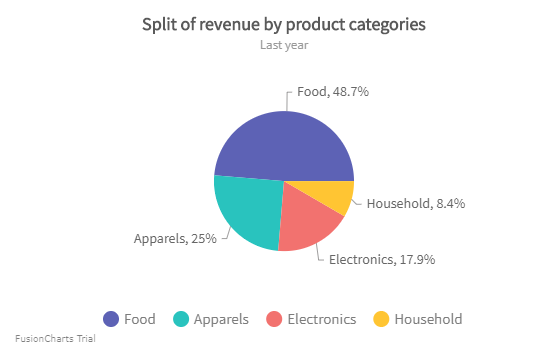
You can now set the radius of the pie chart in percent by setting the value of pieRadius attribute. When you set the value of pieRadius in percent, the radius of the pie is calculated with respect to the chart canvas space.
Refer to the image shown below:

Click here to know more.
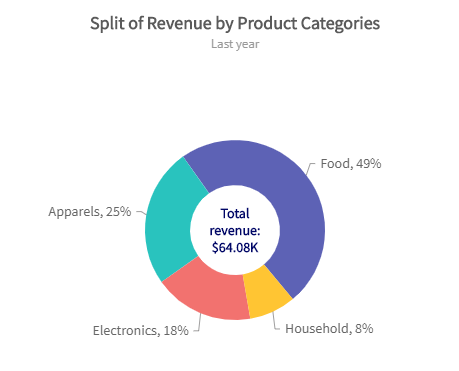
In the doughnut chart, you can apply the pieRadius attribute to set the radius of the upper threshold of the doughnut chart.
Refer to the image below:

Click here to know more.
Deprecated
Following is the list of deprecated attributes:
placeXAxisLabelsOnTop
Treemap specific attributes:
labelGlowlabelGlowIntensitylabelGlowColorlabelGlowRadius