Create a Combination Chart Using FusionCharts and ASP.NET Web Form in .NET MVC Framework
FusionCharts.NET is a popular charting library for ASP.NET WebForms, Razor Page and MVC, in .NET Framework, .NET Core and .NET Standard. It utilizes the FusionCharts JavaScript (HTML5) library to render interactive charts.This frees you from the tedious process of writing long stretches of avoid writing complex JavaScript and JSON code. Instead, you can simply use the methods and properties provided by FusionCharts .NET to render charts in C# or VB.NET.
Architecture Overview
You can understand the basic architecture of FusionCharts.NET at a glance from the diagram given below:
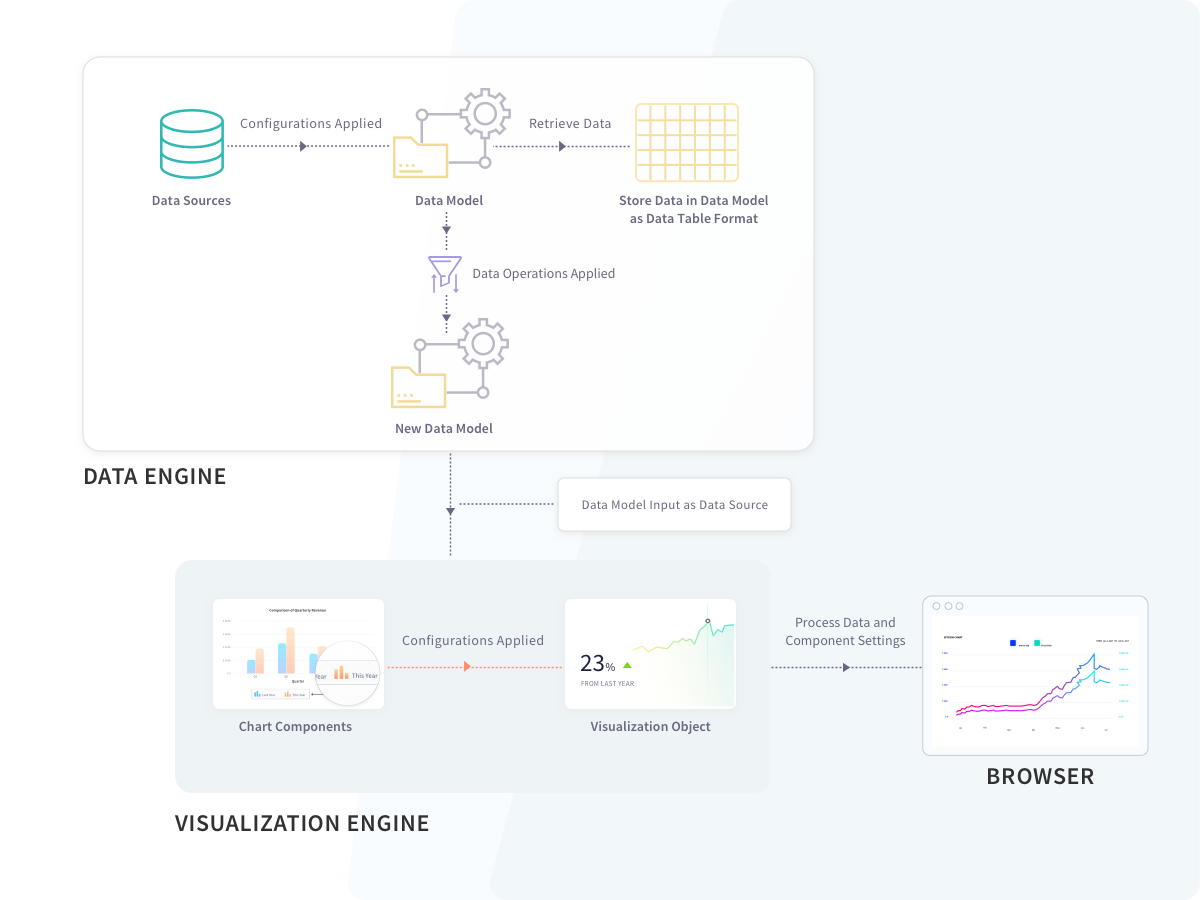
As you can see, FusionCharts.NET is structured into two major modules - the Data Engine and the Visualization Engine. The first one deals with the data, while the second takes care of the rendering process and displays the chart on the browser.
Data Engine
The Data Engine of FusionCharts.NET lets you store data and perform various operations on it. That way, you get plenty of options to optimize and transform the data to suit your requirements, before you send it to the chart renderer. The Data Engine consists of the following:
Data Sources, which receives the raw data and creates an object to provide the data to the DataModel.
Data Operations, which you can apply to a DataModel, to create another optimized DataModel. You can send any of these DataModels to the Visualization Engine.
DataModel, which receives and stores optimized data. The Visualization Engine of FusionCharts.NET can only accept data in the form of a DataModel to render a chart.
Visualization Engine
The Visualization Engine of FusionCharts.NET renders the chart using the data you send to it through the DataModel. You can also configure functional and cosmetic attributes in the data that comes from the data engine. The final chart includes those configurations.
Overview of Combination Charts
Combination charts help you plot multiple data sets on the same chart. You also have the option to plot multiple chart types on the same chart. This means you can specify the plot type for each different data plot in the chart. For example, you can show a column, a line, and an area chart within the same chart canvas.
Prerequisites
Before you can build charts with FusionCharts.NET, you need to configure your system to have these loaded:
Visual studio IDE and .NET framework v3.5 (or later)
FusionCharts Suite XT, which you can download from here.
FusionCharts.NET assembly, which you can get here.
FusionCharts.NET supports many different types of charts. You can find them all listed here. In this blog, you will see how to render a combination chart in .NET.
Step 1
Create a web application in visual studio. Open Visual Studio and follow the steps mentioned below:
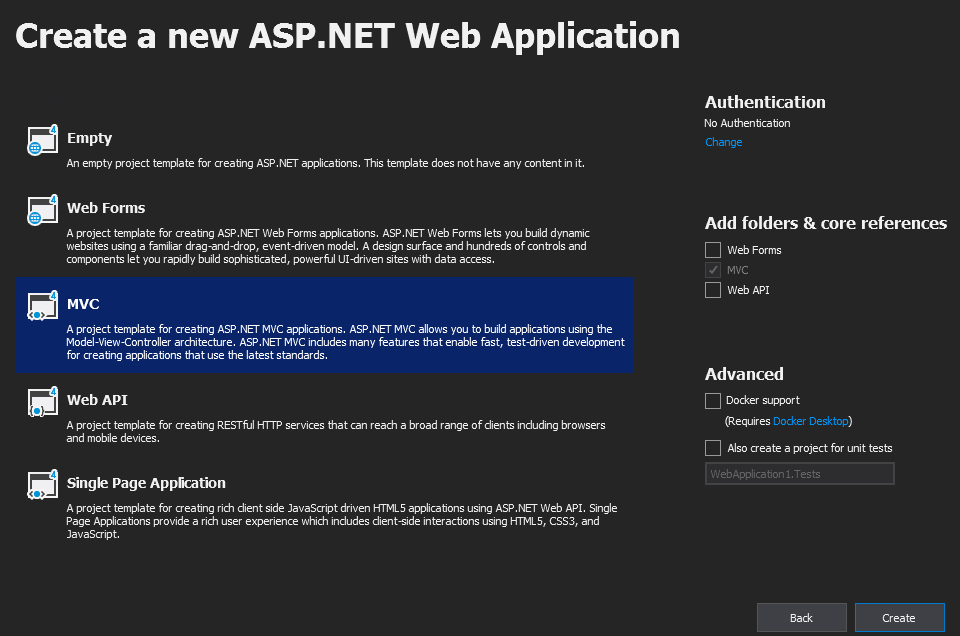
Click on Create a New Project → ASP.NET Web Application (.NET Framework)
Type the project name.
Click on Create.
Click on MVC (as shown in the screenshot below).
Click on Create.
Step 2
It's time to add Fusioncharts JavaScript files in this project. Right click on Scripts folder and follow the steps mentioned below:
Click on Add Existing Item.
Browse to FusionCharts JavaScript files and add them.
When you are done, the Solution Explorer will look like the following:

Step 3
Now, add a new View in this project. The chart will be rendered inside this view. To do so, right click on the Views folder and follow the steps mentioned below:
Click on Add
Click on View…
Click on MVC 5 View
Click on Add
Type the name of the View as CombiChart (as shown in the screenshot below)
Click on Add.
Step 4
Now, add reference of FusionCharts JavaScript files and necessary tags in this view. Navigate to the CombiChart.cshtml page and add the following lines:
@{ Layout = null; }
<html>
<head>
<script src="@Url.Content("/Scripts/FusionCharts/FusionCharts.js")"></script>
<script src="@Url.Content("/Scripts/FusionCharts/themes/fusioncharts.theme.fusion.js")"></script>
</head>
<body>
<div>
<div id="chartContainer">@Html.Raw(ViewData["Chart"])</div>
</div>
</body>
</html>Step 5
It's time to add reference of FusionCharts.NET in this application. To do so, right click on References and follow the steps mentioned below:
Click on Add Reference
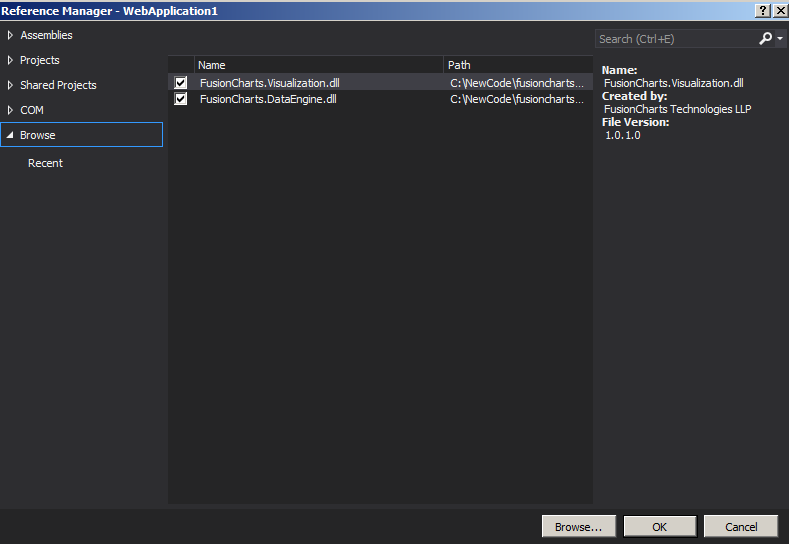
Browse to and add both FusionCharts.Visualization.dll and FusionCharts.DataEngine.dll (as shown in the screenshot below)
Click Ok.
Step 6
Now you need to use FusionCharts.DataEngine and FusionCharts.Visualization reference in controller. To do that, open the Controller folder and add the following lines to the HomeController.cs file:
using FusionCharts.DataEngine;
using FusionCharts.Visualization;Step 7
Open HomeController.cs and add a new action, CombiChart(). This action will return the chart rendering string to CombiChart.cshtml. In this example, you are fetching data from a JSON file, stored in the FusionCharts GitHub repository. Apart from this, you can also fetch data from SQL Server, or from a CSV file.
Add the following code in the CombiChart action:
public ActionResult CombiChart() {
// Initialize DataModel object
DataModel model = new DataModel();
// Create object of JsonFileSource. Provide the file path as a parameter for the constructor
JsonFileSource jsonFileSource = new JsonFileSource("https://raw.githubusercontent.com/poushali-guha-12/SampleData/master/mscombi2d.json");
// Add json source in DataSources store of model
model.DataSources.Add(jsonFileSource);
// Initialize combination chart object
Charts.CombinationChart combiChart = new Charts.CombinationChart("mscombi2d");
// Set model as data source
combiChart.Data.Source = model;
// Provide field name, which should be rendered as line column
combiChart.Data.ColumnPlots("Actual Revenue");
// Provide field name, which should be rendered as line plot
combiChart.Data.LinePlots("Projected Revenue");
// Provide field name, which should be rendered as area plot
combiChart.Data.AreaPlots("Profit");
// Set XAxis caption
combiChart.XAxis.Text = "Month";
// Set YAxis caption
combiChart.PrimaryYAxis.Text = "Amount (in USD)";
// Set chart caption
combiChart.Caption.Text = "Harry's Supermart";
// Set chart sub caption
combiChart.SubCaption.Text = "Sales analysis of last year";
// Set the width and the height of the chart
combiChart.Width.Pixel(600);
combiChart.Height.Pixel(500);
// Set the theme
combiChart.ThemeName = FusionChartsTheme.ThemeName.FUSION;
// Set chart rendering string in ViewData as a key-value pair
ViewData["Chart"] = combiChart.Render();
// Return the view
return View();
}Rendered Chart
The output will look as shown below:

Click here to edit this chart.
List of Plot Types You Can Create Using FusionCharts .NET
Column
Area
Line
Spline
SplineArea
Combination Chart with Dual Y-Axis
If you set the DualY property to true (using the code shown below), the Visualization Engine will render a chart with a secondary Y-axis.
combiChart.DualY = true;Click here to edit a live Dual Y-axis chart.
Render 3D Combination Chart
If you set the ThreeD property to true (using the code shown below), the Visualization Engine will render a 3D combination chart.
combiChart.ThreeD = true;Click here to edit a ThreeD combination chart.
Render Scrollable Combination Chart
If you set the Scrollable property to true (using the code shown below), the Visualization Engine will render a Scrollable Combination chart
combiChart.Scrollable = true;Click here to edit a scrollable combination chart.