Create a Column Chart Using FusionCharts and ASP.NET Framework
FusionCharts.NET is a popular charting library for ASP.NET WebForms, Razor Page and MVC, in .NET Framework, .NET Core and .NET Standard. It utilizes the FusionCharts JavaScript (HTML5) library to render interactive charts. This lets you avoid writing complex JavaScript and JSON code. Instead, you can simply use the methods and properties provided by FusionCharts .NET to render charts in C# or VB.NET.
Architecture Overview
You can understand the basic architecture of FusionCharts.NET at a glance from the diagram given below:
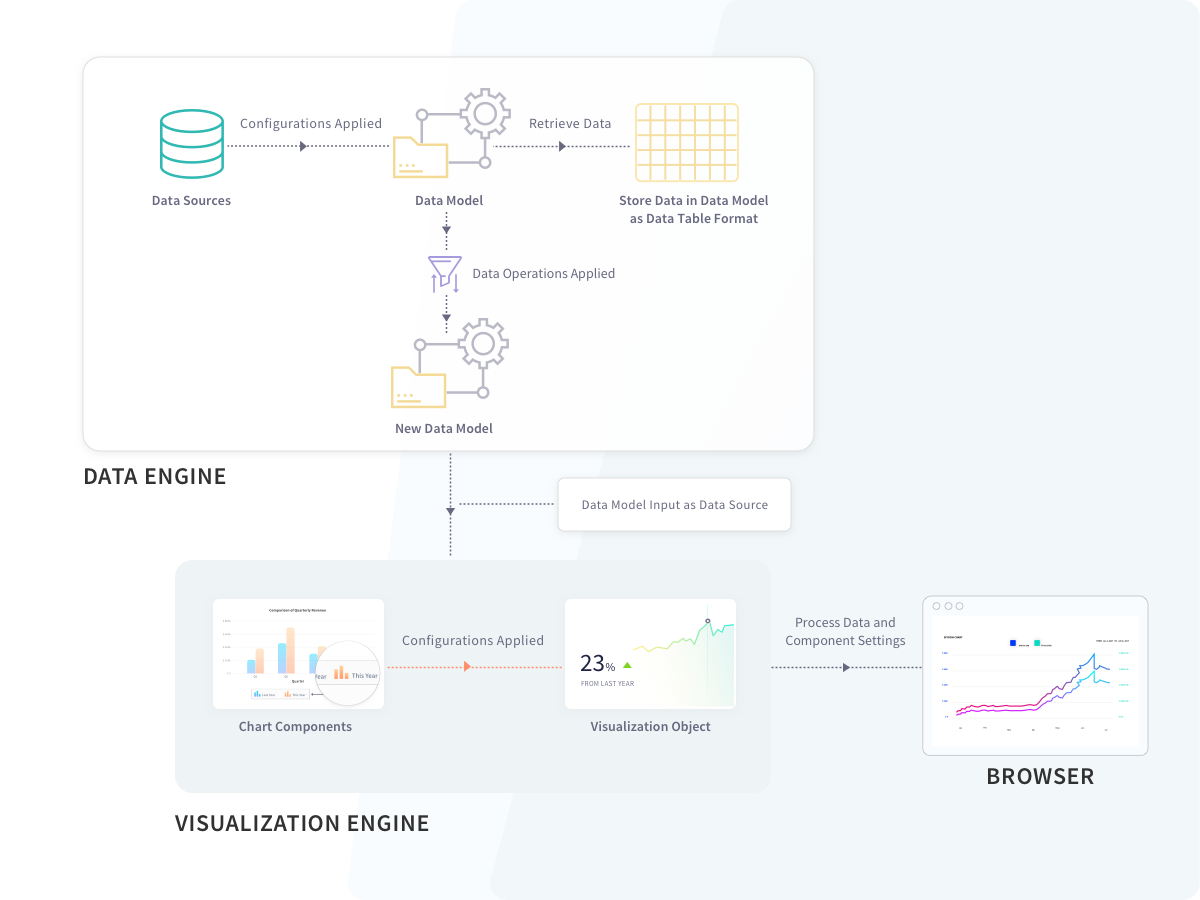
As you can see, FusionCharts.NET is structured into two major modules - the Data Engine and the Visualization Engine. The first one deals with the data, while the second takes care of the rendering process and displays the chart on the browser.
Data Engine
The Data Engine of FusionCharts.NET lets you store data and perform various operations on it. That way, you get plenty of options to optimize and transform the data to suit your requirements, before you send it to the Visualization Engine. The Data Engine consists of the following:
Data Sources, which receives the raw data and creates an object to provide the data to the DataModel.
Data Operations, which you can apply to a DataModel, to create another optimized DataModel. You can send any of these DataModels to the Visualization Engine.
DataModel, which receives and stores optimized data. The Visualization Engine of FusionCharts.NET can only accept data in the form of a DataModel to render a chart.
Visualization Engine
The Visualization Engine of FusionCharts.NET renders the chart using the data you send to it through the DataModel. You can also configure functional and cosmetic attributes in the data that comes from the data engine. The final chart will include those configurations.
Overview of Column Charts
One of the most ubiquitous types of charts, column charts consist of vertical bars placed along a horizontal axis and help you quickly compare various data values.
Prerequisites
Before you can build charts with FusionCharts.NET, you need to configure your system to have these loaded:
Visual Studio IDE and .NET Framework v3.5 (or later)
FusionCharts Suite XT, which you can download from here.
FusionCharts.NET assembly, which you can get here.
FusionCharts.NET supports many different types of charts. You can find them all listed here. In this blog, you will see how to create a column chart with FusionCharts .NET and ASP.NET.
Step 1
Create a web application in Visual Studio. Open Visual Studio and follow the steps mentioned below:
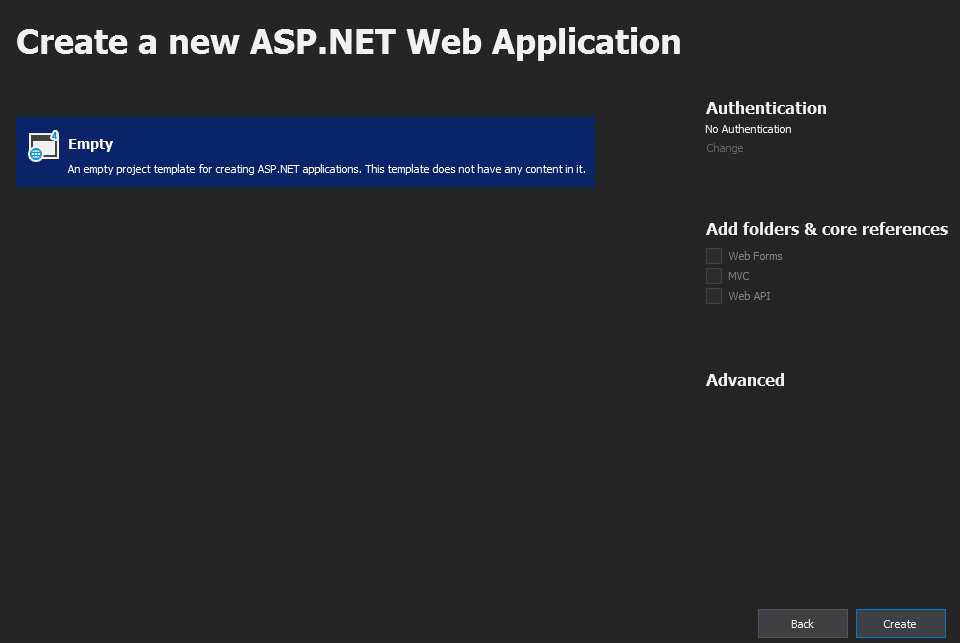
Click on Create a New Project → ASP.NET Web Application (.NET Framework)
Type the project name.
Click on Create.
Click on Empty (as shown in the screenshot below).
Click on Create.
Step 2
Now, add Fusioncharts JS files to this project. To do so:
Create a folder named Script and copy the FusionCharts JavaScript source file in it.
Right click on the name of the solution.
Click on Add → New Folder
Name the new folder Script.
Right click on the Script folder
Click Add Existing Item.
Now, browse to the location where you have downloaded the FusionCharts JavaScript files, to add them to the Script folder. After you add the files, the solution explorer will look as in the screenshot you can see below:

Step 3
Now, add a web form, inside which FusionCharts.NET will render the chart. To add the form:
Right click on the solution
Click Add → Web Form
Name the web form ColumnChart
Click Ok.

Step 4
Add reference of FusionCharts JS and theme files file in the .aspx page of your solution. Navigate to the ColumnChart.aspx page. Within the code, add the following lines inside <script> tags.
<script type="text/javascript" src="Scripts/fusioncharts.js"></script>
<script
type="text/javascript"
src="Scripts/fusioncharts.theme.fusion.js"
></script>Step 5
Now, add a Literal control in ColumnChart.aspx page. Copy and paste the code given below:
<form id="form1" runat="server">
<div>
<asp:Literal ID="Literal1" runat="server"></asp:Literal>
</div>
</form>Step 6
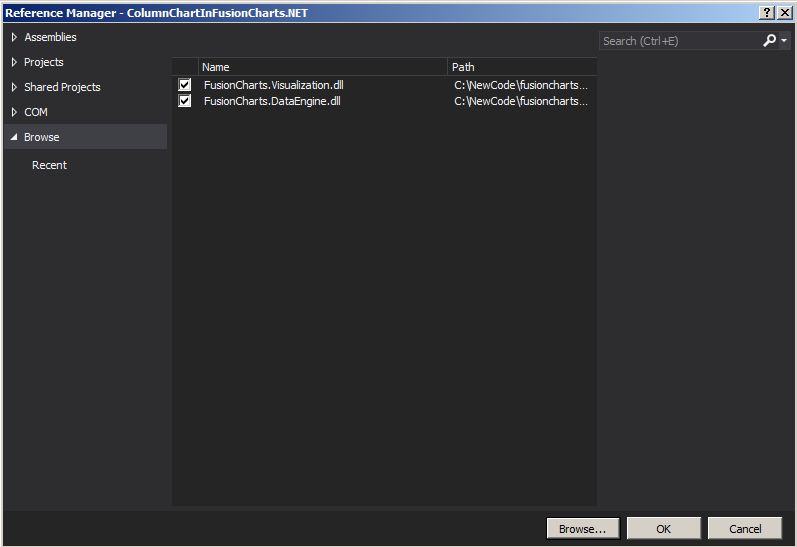
Add reference of FusionCharts.NET in this application. To do so:
Right click on References
Click on Add Reference
From the Reference Manager window, browse to the FusionCharts.Visualization.dll and FusionCharts.DataEngine.dll files. Add both to the application (as shown in the screenshot below).
Click Ok.
Step 7
Use references to both FusionCharts.DataEngine and FusionCharts.Visualization. Navigate to the ColumnChart.aspx.cs page and add the following lines at the top of the code:
using FusionCharts.DataEngine;
using FusionCharts.Visualization;Step 8
Insert the code given below within the PageLoad() event of the ColumnChart.aspx.cs page, to render the Column chart. In this example, you will fetch data from DataTable. However, you can also fetch data from SQL Server, a JSON file, or a CSV file.
// Create data table to store data
DataTable ChartData = new DataTable();
// Add columns to data table
ChartData.Columns.Add("Programming Language", typeof(System.String));
ChartData.Columns.Add("Users", typeof(System.Double));
// Add rows to data table
ChartData.Rows.Add("Java", 62000);
ChartData.Rows.Add("Python", 46000);
ChartData.Rows.Add("Javascript", 38000);
ChartData.Rows.Add("C++", 31000);
ChartData.Rows.Add("C#", 27000);
ChartData.Rows.Add("PHP", 14000);
ChartData.Rows.Add("Perl", 14000);
// Create static source with this data table
StaticSource source = new StaticSource(ChartData);
// Create instance of DataModel class
DataModel model = new DataModel();
// Add DataSource to the DataModel
model.DataSources.Add(source);
// Instantiate Column Chart
// "first-chart" is chart id
Charts.ColumnChart column = new Charts.ColumnChart("first_chart");
// Set the width and the height of the chart in pixels
column.Width.Pixel(700);
column.Height.Pixel(400);
// Set DataModel instance as the data source of the chart
column.Data.Source = model;
// Set Chart Caption
column.Caption.Text = "Most popular programming language";
// Set chart Subcaption
column.SubCaption.Text = "2017-2018";
// Hide chart Legend
column.Legend.Show = false;
// Set X-axis text
column.XAxis.Text = "Programming Language";
// Set Y-axis text
column.YAxis.Text = "User";
// Set chart theme
column.ThemeName = FusionChartsTheme.ThemeName.FUSION;
// Render chart in Literal
Literal1.Text = column.Render();Rendered Chart
The rendered chart will look as shown below:

Click here to edit the column chart.
Render Column Chart with Multiple Series
If the DataModel has more than one value column, the Visualization Engine will automatically render a Multi Series Column Chart.
Click here to edit a column chart with multiple value fields.
Render 3D Column Chart
If you set the ThreeD property to true (using the code shown below), the Visualization Engine will render a 3D column chart.
column.ThreeD = true;Click here to edit a ThreeD column chart.
Render Overlapped Column Chart
If the DataModel has two or more value columns and you set the Overlapped property to true, then the Visualization Engine will render an overlapped column chart.
column.Overlapped = true;Click here to edit an overlapped column chart.
Render Scrollable Column Chart
If you set the Scrollable property to true (using the code shown below), the Visualization Engine will render a Scrollable Column chart.
column.Scrollable = true;Click here to edit a scrollable column chart.