Creating a Real-Time Bitcoin Ticker in JavaScript
Bitcoin, the popular cryptocurrency that’s going to replace traditional fiat currency in the future - say many crypto enthusiasts. Well, that’s a fact that’s becoming more of fiction, specially after last year, when Bitcoin prices rose up astronomically to potentially hit the \$20,000 mark. While the entire world has been hoping for Bitcoin to rise and stabilize, in reality the currency has fallen and remains unstable.
As more trading portals and online websites monitor bitcoin price fluctuations, it’s very important to monitor these real-time changes during trading of bitcoin and other crypto currencies. On that note, we have built a real-time bitcoin ticker dashboard. This tutorial gives a step by step guide on how to create this mini dashboard, using JavaScript, Bitcoin API and FusionCharts.
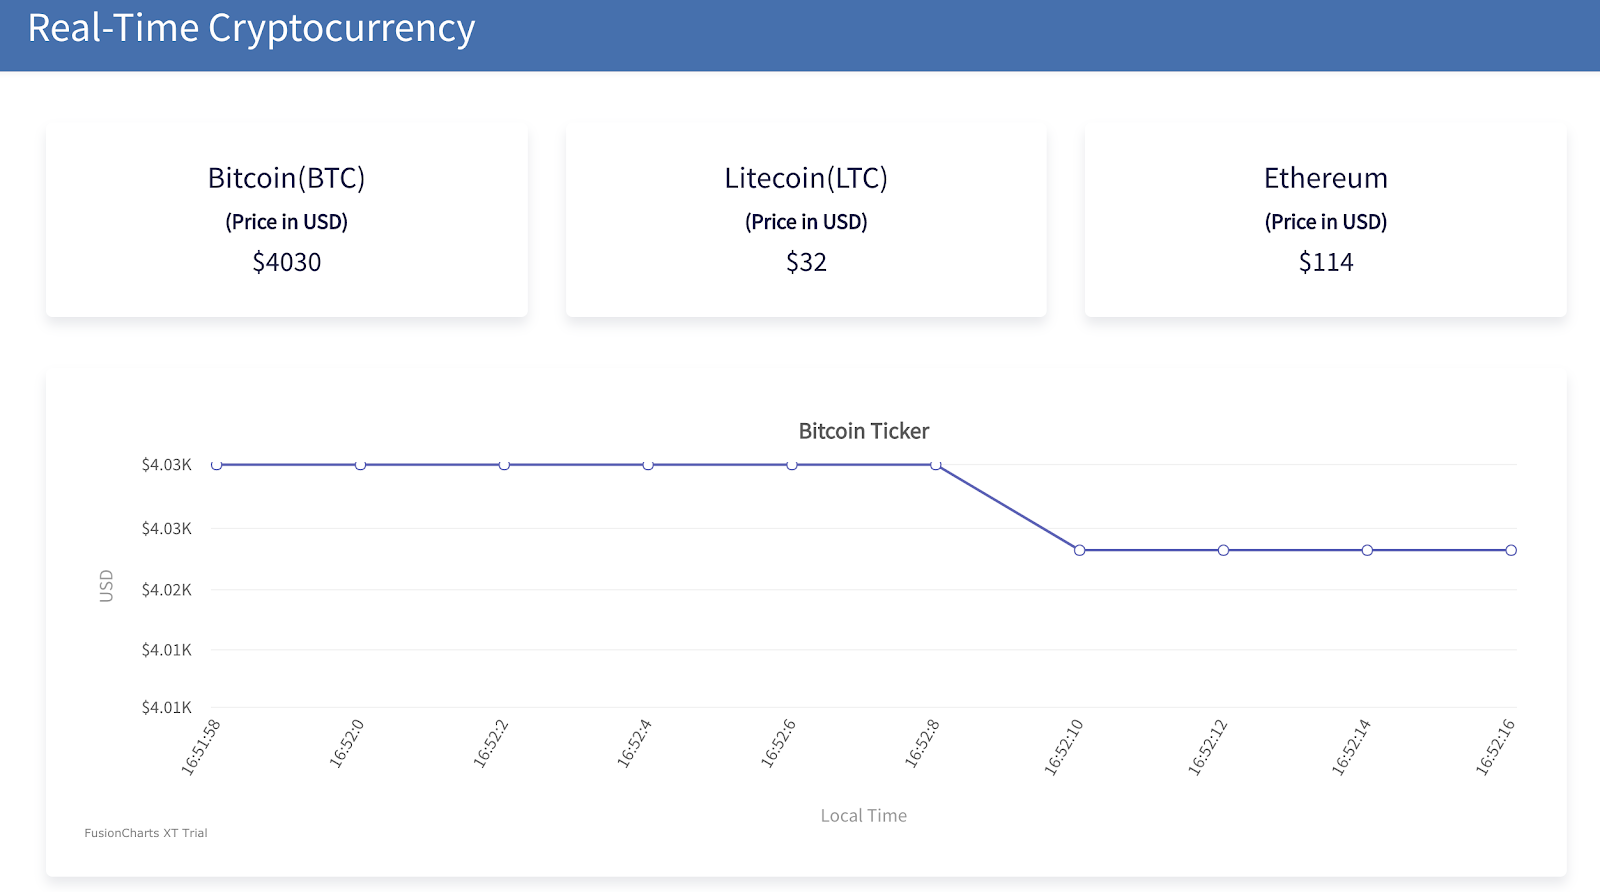
By the end of this tutorial, you will be able to build a Real-Time Cryptocurrency Dashboard like this:
Check out the Bitcoin Ticker Live Dashboard here.
The 3 KPIs on top showcase real-time values of top cryptocurrencies like Bitcoin, Litecoin and Ethereum. This line-chart below the KPIs demonstrate a Bitcoin Ticker where the variation in bitcoin prices are captured. The x-axis denotes the timestamp variation and y-axis indicates the bitcoin prices in $.
Including Dependencies
Before we start, we need to set up the following dependencies:
1.FusionCharts Core JS Files- Download Link
NOTE : Include the core JS files (inside the tag) downloaded as part of the FusionCharts package, in the HTML file:
<script
type="text/javascript"
src="http://cdn.fusioncharts.com/fusioncharts/latest/fusioncharts.js"
></script>
<script
type="text/javascript"
src="https://cdn.fusioncharts.com/fusioncharts/latest/themes/fusioncharts.theme.fusion.js"
></script>Including and Initializing Cryptonator API
The Cryptonator API data source is defined at the top of the script tag. The API returns a JSON dump, which we have converted as the JavaScript object "data" (passed on to this function as an argument).
Given below is the API URL, this will fetch the real-time data for the Bitcoin Ticker: https://api.cryptonator.com/api/ticker/btc-usd
Navigate to the requested URL, and the values returned should be visible in the browser. Furthermore, replace btc-usd with the currency codes like eth-usd, ltc-usd to fetch the values of Ethereum and Litecoin.
IMPORTANT : You may encounter a CORS issue while using the Cryptonator API, where your server may be blocked after sending repeated requests to the API. You can learn more about the CORS issue you may face here: http://cors.io/ . One quick way to bypass the CORS issue is by using AWS Lambda for server-less architecture or setting up a backend server and making requests via it. Use the below syntax to resolve the issue.
const api_url = 'https://cors.io/?https://api.cryptonator.com/api/ticker/';Let’s get into the detailed code snippets to understand the ticker better.
Dashboard Structure and Layout
I have used Bootstrap 4 here to build this responsive dashboard. With new components, responsive structures and styles, it is a consistent framework that supports major of all browsers and CSS compatibility fixes.
The components present in the page are :
- Dashboard Header
- Cryptocurrency Values
- Bitcoin Ticker
Fetching the JSON Data
The XMLHttpRequest object can be used to request data from a web server. To send a request to a server, open() method of the XMLHttpRequest object is used.
| open(method, url, async) | Specifies the type of request |
|---|---|
| method | the type of request: GET or POST |
| url | the server (file) location |
| async | true (asynchronous) or false (synchronous) |
JS Implementation: Functions and Descriptions
Given below is the table which describes the functions and their corresponding outcomes.
| functions | outcome |
|---|---|
| bitcoinDataHandler() | Returns the price for Bitcoin |
| ethereumDataHandler() | Returns the price for Ethereum |
| litecoinDataHandler() | Returns the price for Litecoin |
| clientDateTime() | Returns the current timestamp for the chart |
| updateData() | The chart is referenced with its ID and the data is fed to the chart |
Creating the Chart Container
Every chart displayed on a web page is rendered within a unique HTML container.
We will use the <div> element for creating the HTML container for our chart.
Given below is the code for creating the chart container:
<body>
<div id="chart-container"></div>
</body>Creating the Chart Instance
Real-Time Chart : A real-time line chart is used to show the magnitude of a price in real-time. Data is updated automatically at fixed intervals by getting new data from the server, without any page refreshes. Data values are plotted on the chart as data points that are then connected using line segments. This chart can be simulated as a real-time bitcoin price monitor which updates after a fixed interval of time.
To access the Real-Time Data Charts provided by FusionCharts, goto Real-Time Charts.
To create a real-time chart follow the steps given below:
- Within the JSON data, the attributes and their corresponding values can be set in the format :
<attributeName> : <value> - The chart type is specified using the type attribute. To render a real-time line chart, set realtimeline.
- The container object is set using the renderAt attribute.
- Set refreshinterval to 2, the chart gets updated every 2 sec.
- The dimension of the chart is specified using width and height attributes.
- The type of data (JSON/XML) you want to pass to the chart object is defined using the dataFormat attribute.
Since we have the JSON data and the chart container in place, we will now create the FusionCharts instance. The details required to render the chart, like the chart type, the chart ID, chart dimensions, the HTML container ID, the data format and so on, will be passed to this chart instance.
var fusioncharts = new FusionCharts({
id: 'stockRealTimeChart',
type: 'realtimeline',
renderAt: 'chart-container',
width: '100%',
height: '350',
dataFormat: 'json',The data source required to render the real-time chart is given below:
dataSource: {
chart: {
caption: 'Bitcoin Ticker',
subCaption: '',
xAxisName: 'Local Time',
yAxisName: 'USD',
numberPrefix: '$',
refreshinterval: '2',
slantLabels: '1',
numdisplaysets: '10',
labeldisplay: 'rotate',
showValues: '0',
showRealTimeValue: '0',
theme: 'fusion',
yAxisMaxValue: bitcoinDataHandler().toString() + 20,
yAxisMinValue: bitcoinDataHandler().toString() - 20,
},
},
});We can customize the functionality of a real-time chart in great detail. For example, we can define refresh interval, update interval, decimal precisions, canvas and chart margins, etc.
- In addition to this, FusionCharts provides ability to log messages depending on certain predefined conditions.
- Use the feedData(strData) method provided by FusionCharts to feed data to the chart. Here, strData is a string value which contains data in the same format as that provided by the real-time data provider page. Also, feedData takes care of any delay that occurs during auto refresh or on page load.
- updateData() function builds the data (in the real-time data format) to be specified for the chart. This function is invoked with a JavaScript interval.
We will now create a file called bitcoinstyle.css which will contain all the styles and CSS techniques for our dashboard. Here’s how it looks like:
.navbar-dark {
background-color: #4670ad;
box-shadow: 0 2px 4px 0 rgba(0, 0, 0, 0.04);
min-height: 65px;
}
.logo {
color: #ffffff;
font-weight: 500;
text-transform: capitalize;
}
.card {
border-radius: 5px;
box-shadow: 0 6px 14px 0 rgba(33, 35, 68, 0.1) !important;
}
.kpi-value {
font-weight: 500 !important;
}Rendering The Chart
Now call the render() method for the chart instance to render the chart, as given below:
fusioncharts.render();The HTML and JS for the Bitcoin component before the final render looks like this:
HTML Section:-
<!DOCTYPE html>
<html lang="en">
<head>
<meta charset="UTF-8">
<meta name="viewport" content="width=device-width, initial-scale=1.0">
<link rel="stylesheet" href="bitcoinstyle.css">
<meta http-equiv="X-UA-Compatible" content="ie=edge">
<title> Bitcoin Ticker</title>
<!-- design system files -->
<link rel="stylesheet" href="https://ds.fusioncharts.com/2.0.8/css/ds.css">
<script src="https://ds.fusioncharts.com/2.0.8/js/ds.js"></script>
<script type="text/javascript" src="http://cdn.fusioncharts.com/fusioncharts/latest/fusioncharts.js"></script>
<script type="text/javascript" src="https://cdn.fusioncharts.com/fusioncharts/latest/themes/fusioncharts.theme.fusion.js"></script>
</head>
<body>
<nav class="navbar navbar-dark">
<h1 class="logo pl-2">Real-Time Cryptocurrency</h1>
</nav>
<div class="container-fluid">
<div class="row text-center mt-4 pl-3 pr-3">
<div class="col-sm">
<div class="card">
<div class="card-body">
<div class="h3">Bitcoin(BTC)</div>
<div class="h5">(Price in USD)</div>
<div id="btc_val" class="h4 kpi-value"></div>
</div>
</div>
</div>
<div class="col-sm">
<div class="card">
<div class="card-body">
<div class="h3">Litecoin(LTC)</div>
<div class="h5">(Price in USD)</div>
<div id="ltc_val" class="h4 kpi-value"></div>
</div>
</div>
</div>
<div class="col-sm">
<div class="card">
<div class="card-body">
<div class="h3">Ethereum</div>
<div class="h5">(Price in USD)</div>
<div id="eth_val" class="h4 kpi-value"></div>
</div>
</div>
</div>
</div>
<div class="row mt-4 pr-3 pl-3">
<div class="col">
<div class="card">
<div class="card-body">
<div id="chart-container"></div>
</div>
</div>
</div>
</div>
</div>
</div>
</body>
</html>JavaScript Section:-
<script>
//Fetch the price of Ethereum
const eth_api_url = 'https://api.cryptonator.com/api/ticker/eth-usd';
function ethereumHttpObject() {
try {
return new XMLHttpRequest();
} catch (error) {}
}
function ethereumGetData() {
var request = ethereumHttpObject();
request.open('GET', eth_api_url, false);
request.send(null);
console.log(request.responseText);
return request.responseText;
}
function ethereumDataHandler() {
var raw_data_string = ethereumGetData();
var data = JSON.parse(raw_data_string);
var base = data.ticker.base;
var target = data.ticker.target;
var price = data.ticker.price;
var volume = data.ticker.volume;
var change = data.ticker.change;
var api_server_epoch_timestamp = data.timestamp;
var api_success = data.success;
var api_error = data.error;
return price;
}
document.getElementById('eth_val').innerHTML = '$' + Math.round(ethereumDataHandler());
//Fetch the price of Litecoin
const ltc_api_url = 'https://api.cryptonator.com/api/ticker/ltc-usd';
function litecoinHttpObject() {
try {
return new XMLHttpRequest();
} catch (error) {}
}
function litecoinGetData() {
var request = litecoinHttpObject();
request.open('GET', ltc_api_url, false);
request.send(null);
//console.log(request.responseText);
return request.responseText;
}
function litecoinDataHandler() {
var raw_data_string = litecoinGetData();
var data = JSON.parse(raw_data_string);
var base = data.ticker.base;
var target = data.ticker.target;
var price = data.ticker.price;
var volume = data.ticker.volume;
var change = data.ticker.change;
var api_server_epoch_timestamp = data.timestamp;
var api_success = data.success;
var api_error = data.error;
return price;
}
document.getElementById('ltc_val').innerHTML = '$' + Math.round(litecoinDataHandler());
//Fetch the value of Bitcoin
const api_url = 'https://api.cryptonator.com/api/ticker/btc-usd';
const time_interval = 2;
function addLeadingZero(num) {
return num <= 9 ? '0' + num : num;
}
function clientDateTime() {
var date_time = new Date();
var curr_hour = date_time.getHours();
var zero_added_curr_hour = addLeadingZero(curr_hour);
var curr_min = date_time.getMinutes();
var curr_sec = date_time.getSeconds();
var curr_time = zero_added_curr_hour + ':' + curr_min + ':' + curr_sec;
return curr_time;
}
function makeHttpObject() {
try {
return new XMLHttpRequest();
} catch (error) {}
}
function bitcoinGetData() {
var request = makeHttpObject();
request.open('GET', api_url, false);
request.send(null);
return request.responseText;
}
function bitcoinDataHandler() {
var raw_data_string = bitcoinGetData();
var data = JSON.parse(raw_data_string);
var base = data.ticker.base;
var target = data.ticker.target;
var price = data.ticker.price;
var volume = data.ticker.volume;
var change = data.ticker.change;
var api_server_epoch_timestamp = data.timestamp;
var api_success = data.success;
var api_error = data.error;
return price;
}
document.getElementById('btc_val').innerHTML = '$' + Math.round(bitcoinDataHandler());
FusionCharts.ready(function() {
var fusioncharts = new FusionCharts({
id: 'stockRealTimeChart',
type: 'realtimeline',
renderAt: 'chart-container',
width: '100%',
height: '350',
dataFormat: 'json',
dataSource: {
chart: {
caption: 'Bitcoin Ticker',
subCaption: '',
xAxisName: 'Local Time',
yAxisName: 'USD',
numberPrefix: '$',
refreshinterval: '2',
slantLabels: '1',
numdisplaysets: '10',
labeldisplay: 'rotate',
showValues: '0',
showRealTimeValue: '0',
theme: 'fusion',
yAxisMaxValue: bitcoinDataHandler().toString() + 20,
yAxisMinValue: bitcoinDataHandler().toString() - 20,
},
categories: [
{
category: [
{
label: clientDateTime().toString(),
},
],
},
],
dataset: [
{
data: [
{
value: bitcoinDataHandler().toString(),
},
],
},
],
},
events: {
initialized: function(e) {
function updateData() {
// Get reference to the chart using its ID
var chartRef = FusionCharts('stockRealTimeChart'),
x_axis = clientDateTime(),
y_axis = bitcoinDataHandler(),
strData = '&label=' + x_axis + '&value=' + y_axis;
// Feed it to chart.
chartRef.feedData(strData);
}
e.sender.chartInterval = setInterval(function() {
updateData();
}, time_interval * 1000);
},
disposed: function(evt, arg) {
clearInterval(evt.sender.chartInterval);
},
},
});
fusioncharts.render();
});
</script>After the successful execution of the code, the page is loaded with the dashboard header, cryptocurrency values and the bitcoin ticker. The Bitcoin, Litecoin and Ethereum prices (in USD) are displayed just below the dashboard header. This Bitcoin Ticker gets updated at a fixed interval of 2 seconds. Hovering on the line chart, at every tooltip the price of bitcoin at that particular timestamp can be observed. The y-axis is configured dynamically in such a way that even with any drastic change in price, the axis of the chart gets modified accordingly. After you have implemented all the steps in this tutorial, your final dashboard will look like this:
You can find the entire source code for the Bitcoin Ticker here → Source Code Link
With the increase in data collection and aggregation, businesses now feel the need for better data visualization to take more informed decisions. FusionCharts has been successful in visualizing data sources across different industry use-cases with 28,000 customers and love from over 750,000 developers world wide. Learn more about FusionCharts and it’s new products like Data-Stories, Dashboards, Export products and more. Happy Visualizing!