Render a Combination Chart Using FusionCharts in .NET Framework Web Form
Overview
FusionCharts.NET is a charting library for ASP.NET WebForms and MVC. It works with all .NET Framework editions, such as .NET Core and .NET Standard.
FusionCharts.NET uses FusionCharts (HTML5) JavaScript library to render interactive charts. The simple methods and properties provided in the suite help you render charts in C#.NET or VB.NET, without writing messy JavaScript or JSON code.
Architecture Overview
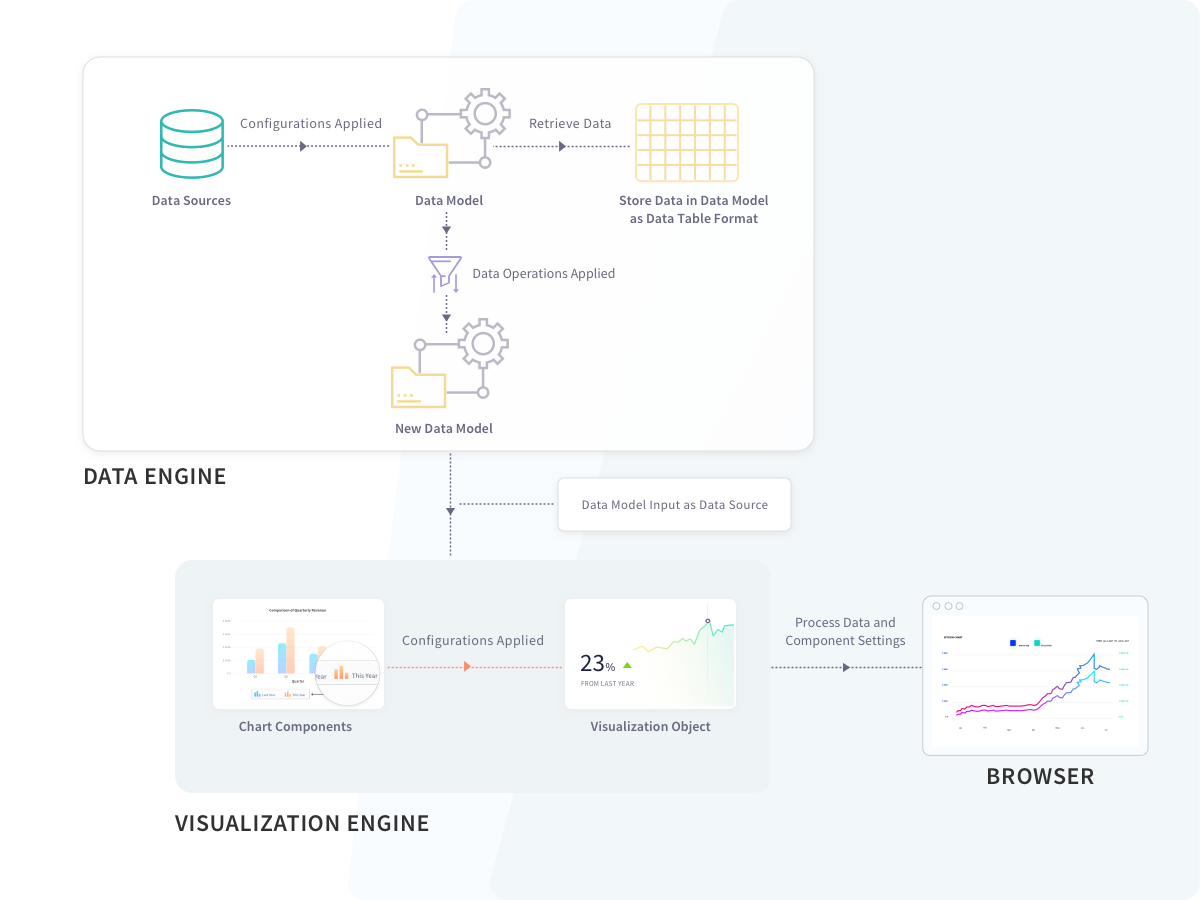
FusionCharts.NET provides you with two modules:
Data Engine: The data engine of FusionCharts.NET lets you store data and perform operations on it. This way, you can transform and optimize the data before sending it to the chart renderer. The data engine consists of the following:
Data Sources: It receives the raw data and creates an object to provide the data to the DataModel.
Data Operations: These can be applied on existing DataModels. A new DataModel is created automatically, whenever you apply an operation on an existing DataModel.
Data Model: The DataModel receives and stores the optimized data. You have to provide a DataModel to the Visualization Engine of FusionCharts.NET, to render charts. Keep in mind that in FusionCharts.NET, the visualization engine can only accept data in the form of a DataModel.
Visualization Engine: The visualization engine of FusionCharts.NET lets you render a chart with functional and cosmetic configurations, after receiving the data from the data engine.
The diagram given below may help you understand the architecture of FusionCharts.NET:
Overview of Combination Charts
Combination charts help you plot more than one data set in the same chart. You can also plot multiple chart types within the same combination chart, by separately specifying the plot type for each data plot in the chart. For example, you can show a line, a column, and an area chart within the same canvas.
Prerequisites
Before you can build charts with FusionCharts.NET, you need to install the following programs in your computer:
Visual Studio IDE and .NET Framework v3.5 (or later)
FusionCharts Suite XT, which you can download from here.
FusionCharts.NET assembly, which you can get here.
FusionCharts.NET supports many different types of charts. You can find them all listed here. In this blog, you will see how to render a combination chart in .NET MVC.
Step 1
Create a web application in visual studio. To do so, open Visual Studio and follow the steps mentioned below:
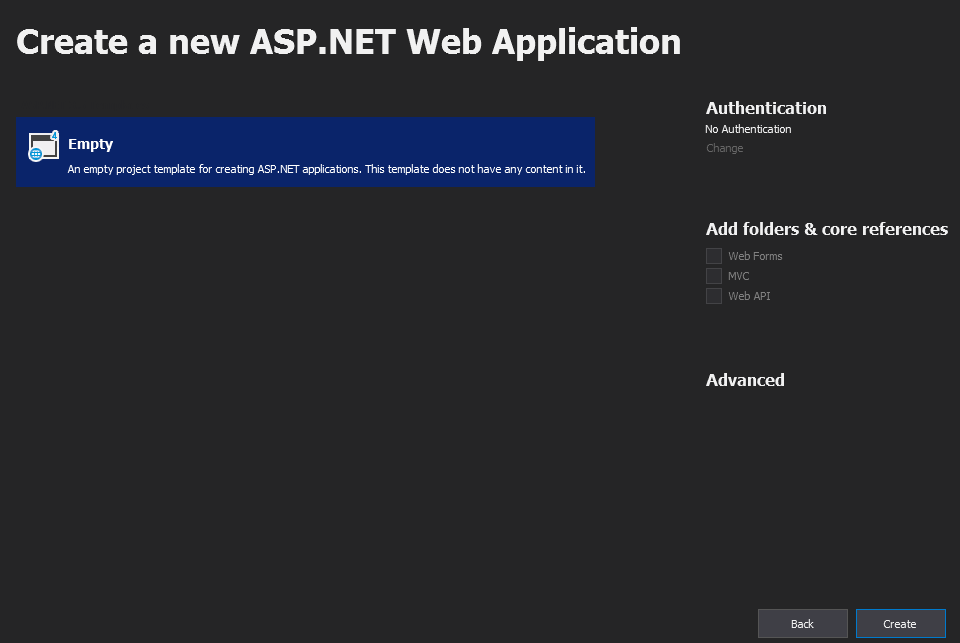
Click on Create a new Project → ASP.NET Web Application (.NET Framework)
Type the name of your project
Click on Create
Click on Empty (as shown in the screenshot below).
Finally, click on Create
Step 2
Now, add Fusioncharts JS files to this project. To do so:
Create a folder named Script and copy the FusionCharts JavaScript source file in it.
Right click on the name of the solution.
Click on Add → New Folder
Name the new folder Script.
Right click on the Script folder
Click Add Existing Item.
Now, browse to the location where you have downloaded the FusionCharts JavaScript files, to add them to the Script folder. After you add the files, the Solution Explorer will look like the screenshot given below:

Step 3
Now, add a web form, inside which FusionCharts.NET will render the chart. To add the form:
Right click on the solution
Click Add → Web Form
Name the web form CombiChart
Click Ok.

Step 4
Add reference of FusionCharts JS and theme files file in the .aspx page of your solution. Navigate to the CombiChart.aspx page. Within the code, add the following lines inside <script> tags.
<script type="text/javascript" src="Scripts/fusioncharts.js"></script>
<script
type="text/javascript"
src="Scripts/fusioncharts.theme.fusion.js"
></script>Step 5
Now, add a Literal control in CombiChart.aspx page. Copy and paste the code given below:
<form id="form1" runat="server">
<div><asp:Literal ID="Literal1" runat="server"></asp:Literal>\*</div>
</form>Step 6
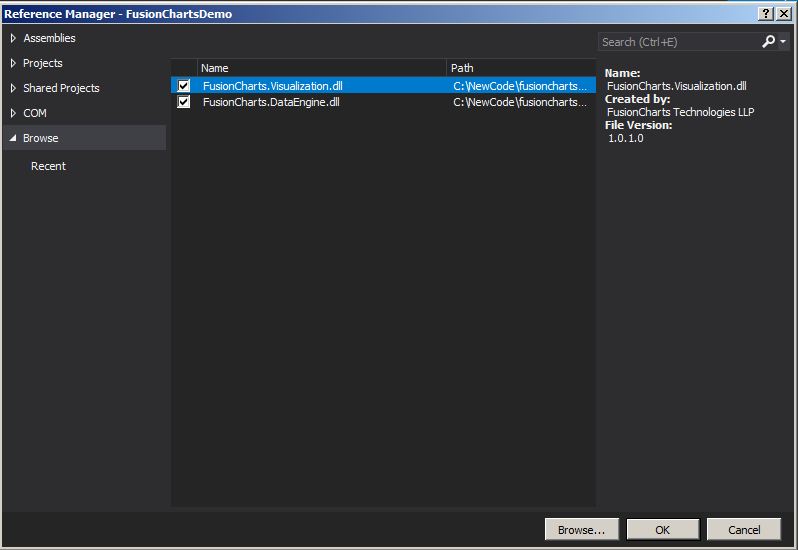
Add reference of FusionCharts.NET in this application. To do so:
Right click on References
Click on Add Reference
From the Reference Manager window, browse to the FusionCharts.Visualization.dll and FusionCharts.DataEngine.dll files. Add both to the application (as shown in the screenshot below).
Click Ok.
Step 7
Use references to both FusionCharts.DataEngine and FusionCharts.Visualization. Navigate to the CombiChart.aspx.cs page and add the following lines at the top of the code:
using FusionCharts.DataEngine;
using FusionCharts.Visualization;Step 8
Insert the code given below within the PageLoad() event of the CombiChart.aspx.cs page, to render the Combination chart. In this example, you will fetch data from a JSON file stored in the FusionCharts repository on GitHub. However, you can also fetch data from SQL Server or a CSV file.
// Initialize DataModel object
DataModel model = new DataModel();
// Create object of JsonFileSource. Provide file path as constructor parameter
JsonFileSource jsonFileSource = new JsonFileSource("https://raw.githubusercontent.com/poushali-guha-12/SampleData/master/mscombi2d.json");
// Add json source in datasources store of model
model.DataSources.Add(jsonFileSource);
// Initialize combination chart object
Charts.CombinationChart combiChart = new Charts.CombinationChart("mscombi2d");
// Set model as data source
combiChart.Data.Source = model;
// Provide field name, which should be rendered as line column
combiChart.Data.ColumnPlots("Actual Revenue");
// provide field name, which should be rendered as line plot
combiChart.Data.LinePlots("Projected Revenue");
// provide field name, which should be rendered as area plot
combiChart.Data.AreaPlots("Profit");
// Set XAxis caption
combiChart.XAxis.Text = "Month";
// Set YAxis caption
combiChart.PrimaryYAxis.Text = "Amount (in USD)";
// set chart caption
combiChart.Caption.Text = "Harry's Supermart";
// Set chart sub caption
combiChart.SubCaption.Text = "Sales analysis of last year";
// set width, height
combiChart.Width.Pixel(600);
combiChart.Height.Pixel(500);
// set theme
combiChart.ThemeName = FusionChartsTheme.ThemeName.FUSION;
// Render chart in Literal
Literal1.Text = combiChart.Render();Rendered Chart
The output chart will look as shown below:

Click here to edit this chart.
List of Plot Types You Can Create Using FusionCharts .NET
Column
Area
Line
Spline
SplineArea
Combination Chart with Dual Y-Axis
If you set the DualY property to true (using the code shown below), the Visualization Engine will render a chart with a secondary Y-axis.
combiChart.DualY = true;Click here to edit a live Dual Y-axis chart.
Render 3D Combination Chart
If you set the ThreeD property to true (using the code shown below), the Visualization Engine will render a 3D combination chart.
combiChart.ThreeD = true;Click here to edit a 3D combination chart.
Render Scrollable Combination Chart
If you set the Scrollable property to true (using the code shown below), the Visualization Engine will render a Scrollable Combination chart
combiChart.Scrollable = true;Click here to edit a scrollable combination chart.